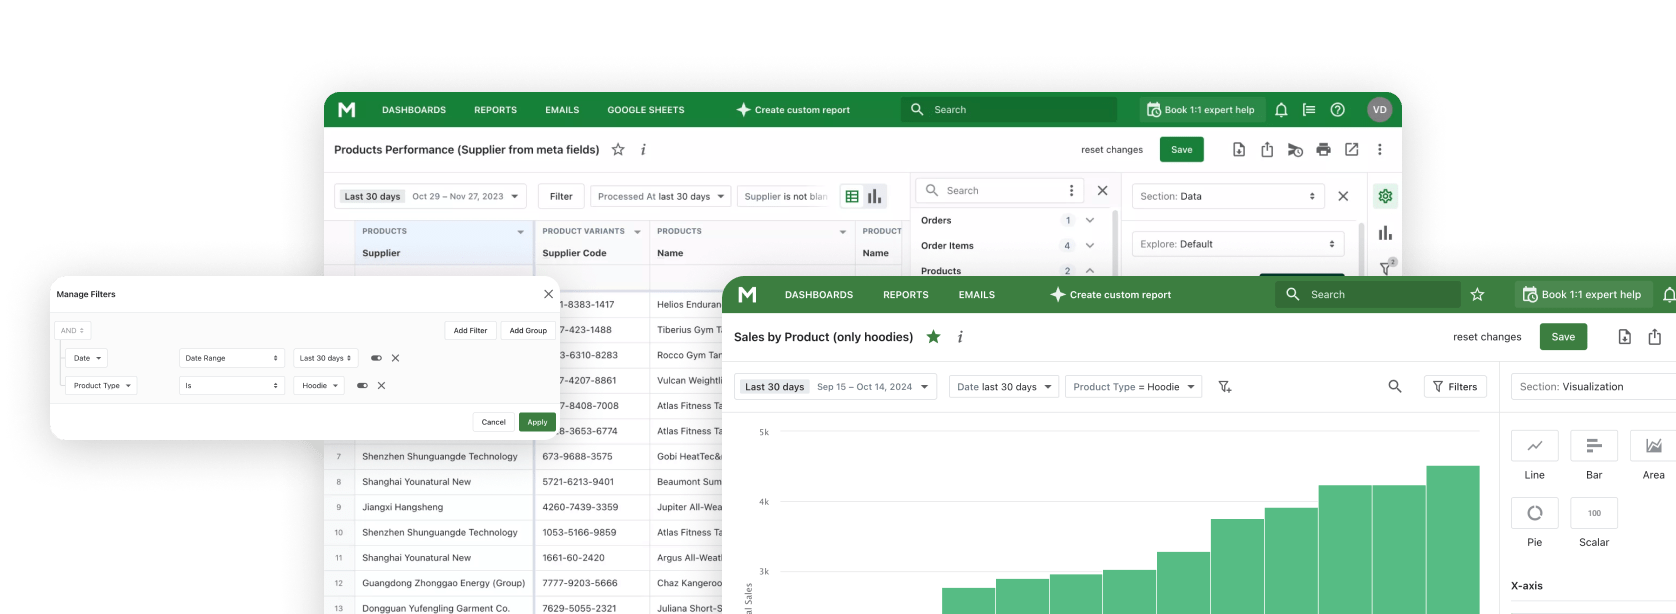

If every question about your store's numbers ends up in your inbox, decide in advance who sees which report, how often it arrives, and which mistake that person is most likely to make with it. Get those three things right and your bookkeeper closes the month, your sales staff know where they stand, and your buyer places the supplier order without waiting for you.
The person asking for a report is often someone other than you: it may be a bookkeeper, an agency, a partner, a digital lead writing on behalf of the finance team, or the accounting department. Each of them brings a different question to the same store data. The reports themselves are covered in our guide to Shopify reports.

The Owner: How Is the Business Doing, and Where Should I Look?
You can see every report, so the job is choosing the few you check on a schedule and letting the rest come to you when something moves.
The numbers that answer the question:
- Revenue for the period, against the same period last year, with margin, average order value, and new vs. returning customers.
- What's growing and what's falling: products trending up or down over 7, 30 and 90 days against the previous period and last year, plus out-of-stock items, dead stock, and an ABC split. One merchant asked for this as a dashboard for a 15-minute daily management review.
- Staff cost as a percentage of each salesperson's sales. Once your team's pay is tied to their sales, this tells you whether payroll is in proportion to what the team brings in.
- Customer lifetime value against acquisition cost, so you know what a new customer is worth before you decide how much to pay for one. One level deeper: which products bring customers back for a second order.
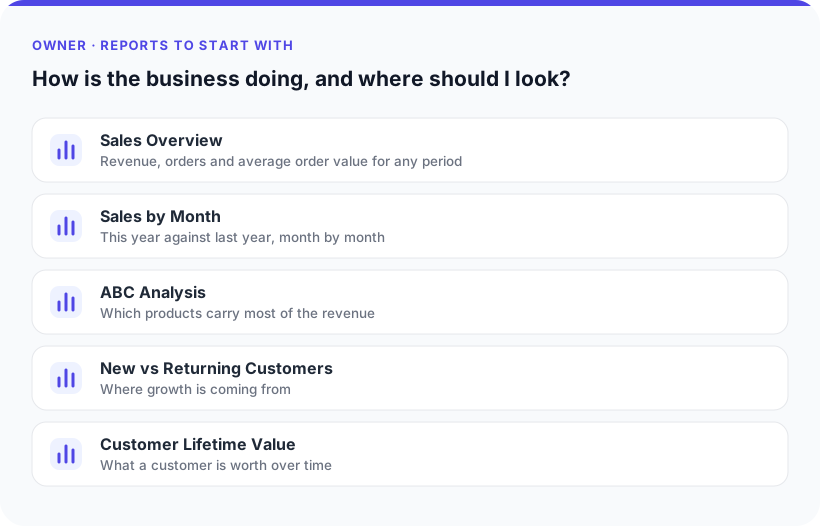
When: the dashboard daily, before the morning review; the year-over-year comparison monthly. Put the daily part on a Shopify dashboard.
The trap: one headline number that quietly mixes different things. A store in Germany got three different daily sales totals from three reports, then added up the orders by hand and got a fourth. The owner only wanted to know how much the store had brought in that day before returns and cancellations, and each report was answering a slightly different question. Pick one definition (gross, net, or total sales) as your daily number, keep it in one place, and stop comparing it with the others.
A related trap: orders with a 100% discount, such as gifts or influencer seeding, counted alongside paid orders. They add nothing to net revenue, but they inflate order count and units sold, and if they're counted as orders, they pull average order value down. Decide whether they belong in your headline figures and filter accordingly.
The Bookkeeper: Which Number Goes in the Books?
The bookkeeper is often external, and their question is narrow and precise: which figure do I record, and how do I explain the difference from what Shopify Finance shows?
The numbers that answer the question:
- Net sales excluding VAT, and VAT broken down by rate. A tax report or tax collected report covers this; US stores filing in several states will want the tax by state report.
- Transactions and payouts, kept separate from sales. See the guides to transaction reports and payout reports.
- Receivables at month end, with unfulfilled orders as a separate list. An order that hasn't shipped may already be paid, so it isn't automatically money owed to you.
- Inventory value at month end (see inventory valuation).
- Store credit and gift cards, plus lost chargebacks by the date they were resolved.
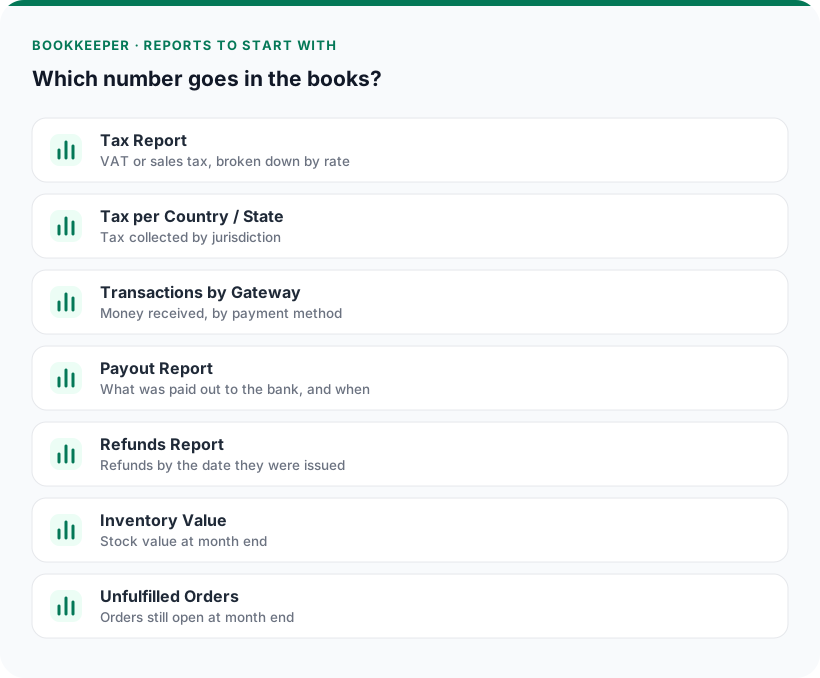
When: on the 1st of the month for the close. A furniture manufacturer's bookkeeper took about a week to set up a month-end package: net sales, taxes, store credit, gift cards, discounts, inventory value, receivables, and unfulfilled orders. It now arrives automatically on the 1st of every month.
The trap: reading orders when the question is about transactions and payouts. An order is dated when the customer placed it. A payment is dated when the money was received. A payout is dated when it is paid out to your bank account. Refunds, order edits, and fulfillments each carry dates of their own, and a sales report may count a return on the day it happened rather than on the original order date. Put a sales report next to a payments summary and they won't match line by line, because they measure different events. Once that difference is explained, the numbers usually reconcile.
An agency kept a client's sales report in Google Sheets, refreshed once a month, and the bookkeeper compared it with Shopify Finance. The gap came to several thousand euros and was flagged as a discrepancy. Broken down, the gap had three causes:
- The finance summary counted payments received in the period. The sales report counted sales by order date.
- The figure in the sheet was a snapshot taken at the start of the month. Orders from the previous month kept changing for a few days after that as payments came in and orders were edited, so the same report run later showed a different number.
- Compared like for like, the sales report and Shopify's own sales reports differed by about 0.02% across five months.
The setup that came out of it: the sales report is the source for recording sales (net, VAT by rate, total); payments and payouts are reconciled separately against the bank; and the sheet is refreshed weekly instead of once a month.
If you hand one thing to a new bookkeeper, make it a short note saying which report answers "what did we sell" and which answers "what money came in." It will save you a painful first month of reconciliation.
Staff and Sales Reps: How Am I Doing, and What Will I Earn?
If you calculate pay or bonuses from sales reports, letting each salesperson see the same report payroll is based on leaves little to argue about.
The numbers that answer the question:
- Each salesperson's sales by amount, for the periods you pay on (week, month, quarter).
- Each salesperson's sales by order count over the same periods, so a few large orders don't hide a slow month, and vice versa.
- Repeat customers for each salesperson, if you want to reward bringing customers back as well as closing the first sale. A standard new vs. returning split won't give you this on its own: first agree who gets credit when a customer comes back, then build the report around that rule.
- The pay or commission percentage applied to those numbers. Some stores calculate it themselves from the export; others ask for it to be added as a column in the report, so the salesperson sees the sales figure and the resulting amount side by side.
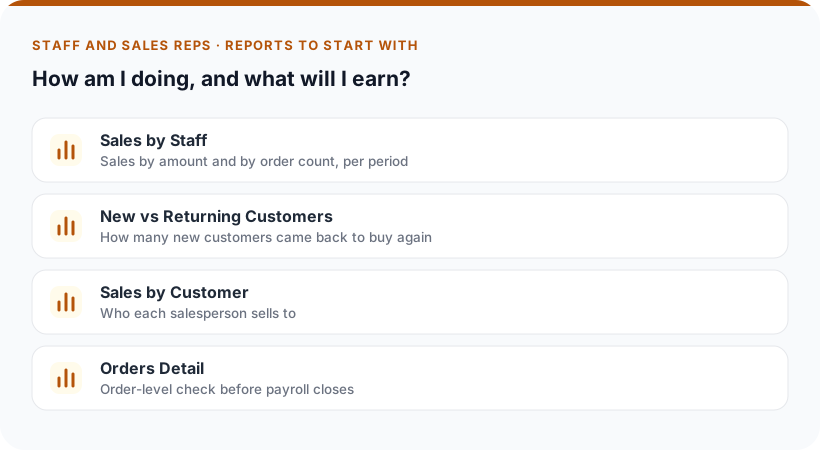
When: daily or weekly for the salesperson's own tracking, and before payroll closes for the calculation itself.
The trap: giving a sales rep full access or none. Share a report built for them instead, with the filters already set. They can read it but not edit it; at most, you let them change the date range.
The same idea works for B2B teams. One wholesale business set up two identical trackers, one for its field sales team and one for national accounts. Each team sees its own accounts, the company name next to the location, and Days Overdue, so they know who to call about late payments without asking finance. One catch they found: a filter like "has payment terms" also let in orders on "Due on receipt" and fixed-date terms, because those have payment terms too. They narrowed it to Net terms only. Check what a filter lets through before you send the report to the team.
The Buyer: What Do I Reorder, and What's Just Sitting There?
The buyer's question has two halves: what to reorder and how much, and what's tied up in stock that isn't moving.
The numbers that answer the question:
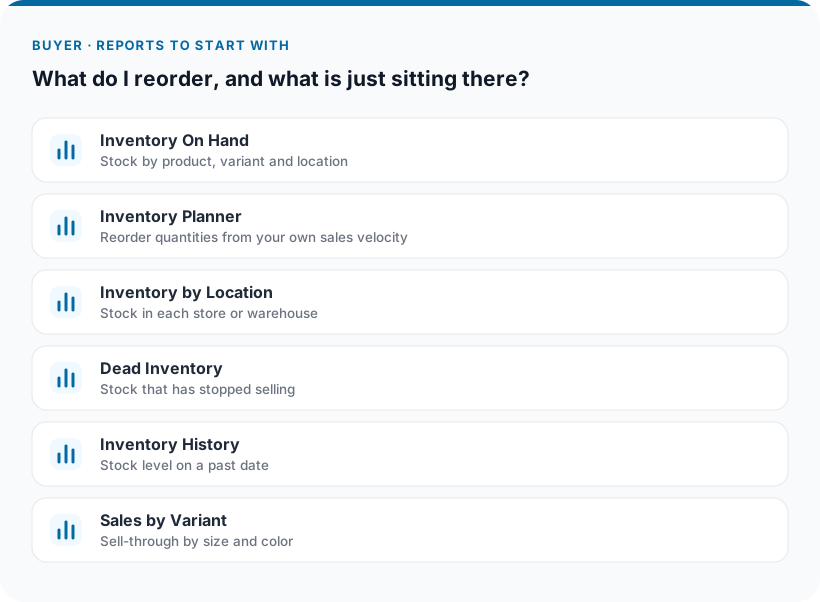
- Stock on hand by product, variant, and location. The Inventory On Hand report is the usual starting point, and our overview of inventory reports covers the rest.
- Suggested reorder quantities based on your own sales velocity and stock coverage, which is what the Inventory Planner report is for.
- Sell-through by size and style, weekly. Our piece on reading sell-through rate explains why a 100% figure can mean you under-ordered.
- Lead time per product, set individually rather than as one figure for everything.
- Dead stock by location, and sales acceleration (for example, the last 3 days against the last 14) to catch a product that's taking off before it runs out.
When: weekly, before the supplier order goes out. The reorder point guide covers the timing side.
The traps:
- Zero velocity on something that sold out. If a product has had no stock for weeks, it has had no sales either, so its recent sales velocity reads zero and points to reordering nothing. Look at velocity from the period before it ran out.
- Stock filtered by one store, demand counted across the whole company. The two halves of the calculation then describe different things. Filter stock and sales to the same scope.
- A company-wide "last sale date" for a single shop. For dead stock at one location, the company-wide date can make an item look active when that shop hasn't sold one in months.
Getting Each Report to the Right Person
Most of the people above need one report, refreshed on a schedule, that they can read but can't change. In Mipler there are three ways to do that:
- Share. A password-protected, view-only link to the report. The recipient opens it in a browser and sees the numbers with the filters you set. If they need to pick their own period, you can allow them to edit the date filter, and switch that off again when it's no longer needed. Useful for an external bookkeeper or a salesperson checking their own figures mid-month.
- Scheduled Emails. The report is sent automatically on a schedule you choose, such as weekly or monthly. Good for anything tied to a date, like the bookkeeper's package on the 1st or the buyer's report before the weekly order.
- Google Sheets. The report goes into a spreadsheet through the Google Sheets integration, for people who already do their work there, like a bookkeeper. If the sheet feeds a reconciliation, refresh it at least weekly.
None of these requires giving the recipient access to the app, so someone who needs one report sees that report and nothing else. If they already have a staff account, sharing a report doesn't change what that account can see.
Explore related reports
Where to Start
For each person on your team, write down one line: the question they keep asking you. Match each question to one report and one delivery date. Start with the bookkeeper, because the month-end close comes around every month, and with your sales staff, because a shared sales report takes the pay calculation out of your inbox. A month from now, the questions still reaching you should be the ones only you can answer.
FAQ
Should my external bookkeeper have access to my Shopify reporting app?
Usually not. A view-only report shared through a password-protected link, or a scheduled email that arrives on the 1st of the month, gives them the numbers they need without access to the app. If they need to choose the period themselves, you can let them edit the date filter on the shared report.
Why don't my sales report and Shopify Finance match?
Most often because they measure different events. Sales reports count orders by order date; finance summaries count payments received in the period; payouts are dated when they are paid out to the bank. A report snapshot taken too early in the month can add to the gap, since last month's orders can still change for a few days. In one real case, a gap of several thousand euros between a sales report and the finance summary came from exactly these two things, while the sales report itself matched Shopify's own sales reports to within about 0.02%.
How do I calculate sales commission for my staff?
Build a report of each salesperson's sales by amount and by order count for the pay period, and, if you reward retention, add repeat customers credited to each salesperson under the rule you agreed on. Apply the commission percentage either in your own spreadsheet or as a column added to the report, and share the report with staff so they see the same figures payroll uses.
What inventory reports does a buyer need before placing a supplier order?
Stock on hand by location, suggested reorder quantities from your own sales velocity, sell-through by size or style, and lead time per product. Check that velocity isn't reading zero simply because the item has been out of stock.