

An inventory report lists the products a business holds, their quantities, and often their location and cost. Depending on the report, it can show a current stock position, a historical snapshot, or how sales are changing the stock you need.
The useful report depends on the question: what can you sell today, how much stock value is tied up in a product, or what should you reorder? Below, compare seven report types and read examples from Mipler, including ABC analysis, inventory planning, and valuation.
What is an inventory report?
An inventory report turns product and stock records into a view you can use to make a decision. A basic version has one row per SKU and location, with a quantity and a reporting date. More detailed reports add unit cost, sales over a selected period, or replenishment estimates.
Always establish what the quantity means. In Shopify, on hand includes available, committed, and unavailable units. Available is the quantity you can sell; incoming units are separate until received. A report using available units will therefore differ from one using all on-hand units. See Shopify's inventory state definitions.
For example, a location with 30 available units, 8 committed units, and 2 unavailable units has 40 units on hand. A further 20 incoming units do not make 60 units ready to sell. Check the column definition before using either quantity to place a purchase order.
Types of inventory reports
Use the question you need to answer to choose a report. These categories overlap: a management report can combine stock, sales, and planning columns in a single view.
| Your question | Report | Fields to check |
|---|---|---|
| Which products need attention? | Inventory management | SKU, location, stock, sales, exception filters |
| Which products contribute most to sales? | Inventory analysis / ABC | Sales period, sales measure, ABC grade |
| When should we replenish? | Inventory forecasting | Sales velocity, stock coverage, lead time, safety stock |
| What can we sell now? | Inventory stock | SKU, location, available and committed quantities |
| What changed during the month? | Monthly inventory | Opening stock, receipts, movements, closing stock |
| What is our stock worth at cost? | Inventory value | Quantity basis, unit cost, total cost |
| How are sales consuming stock? | Sales inventory | Units sold, returns, sales period, remaining stock |
| Which products aren't selling and tie up capital? | Dead stock | Last sale date, average daily sales, days since last sale |
| What did the goods we sold actually cost us? | Cost of goods sold | Unit cost at time of sale, units sold, sales period |
| Does our recorded stock match what's actually on the shelf? | Shrinkage | Ordered, received, sold, and counted quantities |
Examples of inventory reports
Simple inventory report sample
A basic inventory report format starts with the reporting date, location, SKU, and a clearly defined stock quantity. Add unit cost when you need a value column. Here is an illustrative available-stock report for one warehouse on September 1, 2026; the numbers are fictional.
| SKU / item | Available units | Unit cost | Available stock at cost |
|---|---|---|---|
| TEE-01 / Cotton T-shirt | 40 | $8 | $320 |
| CAP-02 / Canvas cap | 15 | $6 | $90 |
| BAG-03 / Tote bag | 25 | $4 | $100 |
| Total | 80 | — | $510 |
Reading the sample: 40 T-shirts at an $8 unit cost account for $320 of the $510 total. The quantity here is available stock. To report all on-hand inventory instead, change the quantity basis and recalculate the values. For multiple warehouses, add a location column and keep one row per SKU and location.
You can use these column headings in a spreadsheet or a reporting tool. Add a sales period and units sold for demand analysis, or opening quantity and movements for a monthly report. Keep a dated copy when you need to compare balances later.
The embedded Mipler tables below contain sample data, not your store's inventory. Use them to understand the fields and how to read a report; select your own locations and reporting period before acting on a result.
Inventory management report
A management report brings stock and sales information together so you can prioritize work. For example, filter for products with stock available but no sales during the last 90 days. That gives you a list to investigate for excess inventory; it does not, by itself, prove that every listed product should be discounted.
- Replenishment review: compare stock coverage with supplier lead time.
- Location review: check whether low stock at one location can be addressed by a transfer.
- Slow-stock review: compare available quantity with recent sales, accounting for seasonality.
- Data quality review: find missing SKUs, untracked quantities, or missing costs before calculating totals.
Start with a Shopify inventory report and keep the columns relevant to the decision. A shorter list of actionable exceptions is often more useful than an export containing every product field.
Explore related reports
Inventory analysis report
An ABC report groups products by their contribution to a chosen measure over a defined period. The measure matters: ranking by sales revenue is not the same as ranking by profit. A high-revenue product can have a low margin, so do not read a sales-based A grade as proof of profitability.
| ProductsName | Product VariantsName | Product VariantsSKU | Product Variant AbcGrade | Inventory LevelsTotal Available | OrdersTotal Sales |
|---|---|---|---|---|---|
| Abominable Hoodie | Blue / XS | MH09-XS-Blue | A | 200 | $4,066.32 |
| Abominable Hoodie | Red / XS | MH09-XS-Red | A | 54 | $3,925.87 |
| Adrienne Trek Jacket | Gray / XS | WJ08-XS-Gray | A | 65 | $2,205.73 |
| Adrienne Trek Jacket | Orange / XL | WJ08-XL-Orange | B | 23 | $1,969.64 |
| Abominable Hoodie | Blue / S | MH09-S-Blue | C | 671 | $1,961.57 |
| Abominable Hoodie | Green / XS | MH09-XS-Green | C | 460 | $2,816.08 |
| Adrienne Trek Jacket | Orange / XS | WJ08-XS-Orange | C | 72 | $1,336.50 |
| Adrienne Trek Jacket | Purple / S | WJ08-S-Purple | C | 87 | $3,769.86 |
| Aero Daily Fitness Tee | Black / XS | MS01-XS-Black | C | 12 | $1,351.80 |
| Aero Daily Fitness Tee | Brown / XS | MS01-XS-Brown | C | 231 | $974.90 |
How to read this example: identify the variant and SKU, then compare its ABC grade, available quantity, and total sales. An important sales contributor with little stock deserves a replenishment review. A lower-grade product with a large quantity may deserve a slower-stock review.
Confirm the grading period and thresholds in the report you use. Shopify's own ABC product analysis is based on revenue; do not assume that every ABC report uses a profit measure or the same settings. The familiar 80/20 rule is a planning heuristic, not a guaranteed distribution in your store.
Inventory forecasting report
A forecasting report uses sales history and planning assumptions to estimate how long stock may last and what to replenish. It is most useful when you can inspect the inputs, rather than treating the suggested order quantity as a certainty.
| ProductsName | Product VariantsName | Inventory LevelsTotal Available | Inventory PlannerSales Velocity | Inventory PlannerStock Covered / days | Inventory PlannerForecast QTY | Inventory PlannerReplenishment QTY | Inventory PlannerReplenishment time / days | Inventory PlannerStockout QTY | Inventory PlannerSafety QTY | Inventory PlannerReorder Point QTY |
|---|---|---|---|---|---|---|---|---|---|---|
| Cassius Sparring Tank | Blue / XS | 15 | 0.53 | 28 | 12 | 15 | 0 | 0 | 3 | 15 |
| Cassius Sparring Tank | Blue / XL | 3 | 0.30 | 10 | 7 | 9 | 0 | 4 | 2 | 9 |
| Cassius Sparring Tank | Blue / L | 4 | 0.23 | 17 | 5 | 7 | 0 | 1 | 2 | 7 |
How to read this example: the Mipler table includes Total Available, Sales Velocity, Stock Covered / days, and Replenishment QTY. Review the stock-coverage estimate alongside your supplier's lead time. Check how the report's selected sales period and planning settings affect the recommendation.
- Sales velocity: units sold per day over the chosen period.
- Lead time: time from placing an order with a supplier until that stock is ready to use.
- Safety stock: a buffer for variability in demand or replenishment time.
- Reorder point: the stock threshold that triggers a replenishment order.
A simple planning example uses reorder point = average daily demand × lead time + safety stock. At 5 units per day, 10 days of lead time, and 20 units of safety stock, the threshold is 70 units. This illustrative calculation is not a claim about the settings of the sample Mipler report. See Shopify's reorder-point guide.
The reorder point tells you when to review replenishment, not necessarily how much to buy. Consider open purchase orders, supplier minimums, pack sizes, and your target coverage before deciding the order quantity. Sales during a stockout can also understate demand.
For the fields and setup, explore the Shopify Inventory Planner report.
Inventory stock report
A stock report answers what is recorded at each location now. Include product, variant, SKU, location, and clearly named quantity columns. Keep available, committed, unavailable, and incoming quantities distinct when those states are present in your data.
For a daily review, filter by location and sort available quantity from lowest to highest. Look at recent sales before prioritizing a low quantity: two remaining units of a slow seller may be less urgent than twenty units of a product selling ten per day.
A current report is also a useful starting point for a physical count. A mismatch may come from an unrecorded receipt, damage, a transfer, or an adjustment. Record the report's timestamp so that sales made during the count do not create a misleading discrepancy.
A table alone does not send low-stock alerts. If you need notifications or scheduled delivery, configure that workflow separately and check its frequency.
A stock report only shows the current state. If you need to see what changed and when - to audit an adjustment, compare a date in the past against today, or investigate a discrepancy - see our guide to viewing Shopify inventory history.
Inventory monthly report
A monthly report helps compare opening and closing stock and explain the movements between them. A month-end snapshot and a stock-movement report answer different questions: one shows the balance at a point in time, while the other explains how it changed.
For an illustrative physical-stock reconciliation, suppose you start with 100 units, receive 40, ship 55, return 5 to sellable stock, and write off 2. The closing physical quantity is 100 + 40 − 55 + 5 − 2 = 88 units. Account for transfers and other adjustments if they apply. A return that has not been restocked should not increase the stock balance.
Monthly inventory report sample
The same illustrative reconciliation can be presented as a movement report for one SKU and location:
| Movement / balance | Units |
|---|---|
| Opening physical stock | 100 |
| Receipts | +40 |
| Shipments | −55 |
| Returns restocked | +5 |
| Write-offs | −2 |
| Closing physical stock | 88 |
Use a consistent location, cutoff time, and quantity definition each month. A list of current stock cannot reconstruct historical month-end balances without snapshots or the relevant movement history.
Shopify provides month-end inventory reports under Analytics → Reports, filtered to Inventory. Check its inventory report documentation for historical-data limitations. Use a Shopify dashboard to present the resulting trends once the underlying balances are comparable.
Inventory value report
An inventory value report adds a monetary measure to a stock quantity. For an operational view at unit cost, calculate quantity × unit cost for each SKU and sum the rows. State which quantity you used: valuing available units gives a different result from valuing all on-hand units.
| ProductsVendor | ProductsName | Product VariantsSKU | Inventory LevelsTotal Available | Inventory ItemsCost | Product VariantsPrice | Inventory ItemsTotal Cost | Inventory ItemsTotal Price |
|---|---|---|---|---|---|---|---|
| Hera | Hera Pullover Hoodie | WH02-XS-Blue | 45 | $32.00 | $48.00 | $1,440.00 | $2,160.00 |
| Ariel | Ariel Roll Sleeve Sweatshirt | WH09-XL-Purple | 42 | $17.00 | $39.00 | $714.00 | $1,638.00 |
| Elisa | Elisa EverCool Tee | WS06-XL-Red | 41 | $18.00 | $29.00 | $738.00 | $1,189.00 |
How to read this example: the sample contains Total Available, Cost, Price, Total Cost, and Total Price. The Hera Pullover Hoodie row shows 45 available units at a $32 unit cost, giving $1,440 at cost. Its $48 selling price gives $2,160 at retail price. These are different measures; retail value is not realized revenue or profit.
Check for missing costs, mixed currencies, duplicate rows, and quantity exclusions before using a total. This sample is an operational report, not a guarantee of an accounting valuation or evidence that historical cost has been preserved.
See the Shopify Inventory Value Report for a closer look at the available fields and how to build the view.
Sales inventory report
A sales inventory report connects demand with remaining stock. Pair units sold during a specified period with current stock for the same SKU. Add returns and a clearly defined sales amount when those are relevant to the decision.
| ProductsVendor | ProductsName | Product VariantsSKU | Order ItemsUnits Sold (at Location) | Inventory LevelsTotal Available |
|---|---|---|---|---|
| Hera | Hera Pullover Hoodie | WH02-XS-Blue | 30 | 45 |
| Ariel | Ariel Roll Sleeve Sweatshirt | WH09-XL-Purple | 12 | 42 |
| Elisa | Elisa EverCool Tee | WS06-XL-Red | 58 | 41 |
How to read this example: the Hera Pullover Hoodie sold 30 units against 45 available - healthy turnover. The Ariel row sold only 12 against 42 available, a much slower ratio worth watching if it continues.
For example, selling 60 units in 30 days gives an average of 2 units per day. With 24 available units, simple stock coverage is 24 ÷ 2 = 12 days. This assumes that demand stays similar and ignores future receipts. If sales velocity is zero, this calculation does not give a meaningful finite coverage estimate.
Use the result to investigate replenishment or excess stock. A promotion, a seasonal peak, or days out of stock can make a short sales window unrepresentative. Stock depletion is also not identical to sales: receipts, transfers, and write-offs can change inventory without creating a sale.
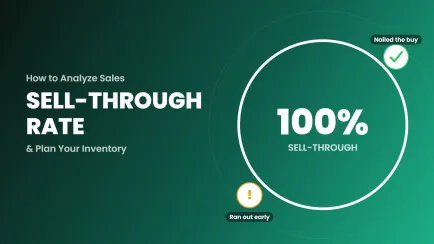
This same "sold against what you had" ratio is also known as sell-through rate - and a rate near 100% isn't always the win it looks like: it can just as easily mean you ran out of stock and lost sales for days.
Dead stock report
A dead stock report flags products with little or no recent demand - typically no sale in a defined window, such as 90 or 180 days. It usually pairs the last sale date with the remaining quantity, so you can see how much capital is sitting in items that aren't moving.
This is a distinct question from inventory value: a product can have a healthy total value and still be dead stock if none of it is selling. Read the last-sale-date column before acting on quantity alone - a recently restocked slow seller looks the same as a genuinely dead one until you check when it last sold.
| ProductsVendor | ProductsName | Product VariantsSKU | Inventory LevelsTotal Available | Inventory PlannerSales Velocity | Product VariantsLast Ordered / Days |
|---|---|---|---|---|---|
| Nova | Nova Canvas Tote | NT01-OS-Black | 64 | 0.02 | 187 |
| Solace | Solace Wool Scarf | SW03-OS-Grey | 38 | 0.05 | 142 |
| Hera | Hera Pullover Hoodie | WH02-XS-Blue | 45 | 1.00 | 3 |
How to read this example: the Nova Canvas Tote hasn't sold in 187 days and moves at 0.02 units/day - effectively dead. The Hera Pullover Hoodie row is included for contrast: 3 days since last order and a sales velocity of 1.00/day is a healthy, moving product, not dead stock.
For the full workflow - thresholds to use, how to separate seasonal slowdowns from genuine dead stock, and what to do once you've found it - see our guide to identifying dead stock in Shopify.
Cost of goods sold (COGS) report
Cost of goods sold is the cost of the units you sold during a period, not the cost of what you're still holding. Where an inventory value report answers "what is my current stock worth," a COGS report answers "what did the goods we already sold cost us."
COGS = units sold × unit cost at time of sale, summed over the period. If cost per item changes over time, most Shopify-connected tools use the cost recorded when the sale happened, not today's cost - check which one a given report uses before comparing periods. Shopify itself only stores one current cost per variant with no history, so a report showing "as of sale" cost is doing extra work to preserve that value; see Shopify's own note on this in its product cost documentation.
| ProductsVendor | ProductsName | Product VariantsSKU | Order ItemsUnits Sold (at Location) | Order ItemsCOGS at Order |
|---|---|---|---|---|
| Hera | Hera Pullover Hoodie | WH02-XS-Blue | 30 | $960.00 |
| Ariel | Ariel Roll Sleeve Sweatshirt | WH09-XL-Purple | 12 | $204.00 |
| Elisa | Elisa EverCool Tee | WS06-XL-Red | 58 | $1,044.00 |
| 100 | $2,208.00 |
How to read this example: the Elisa EverCool Tee sold 58 units at a $18 unit cost, giving $1,044 in COGS - the largest share of the $2,208 total across these three SKUs. Compare this to revenue for the same period to get gross margin per product, not to the inventory value report's current-stock total.
Use COGS alongside revenue for the period to get gross margin, not the raw inventory value total - the two answer different questions and mixing them overstates or understates margin depending on which one you swap in.
Shrinkage report
A shrinkage report compares what should be in stock - based on receipts and sales - against what a physical count actually finds. The gap is shrinkage: damage, theft, misplacement, or a data-entry error, and the report itself usually can't tell you which.
The reconciliation is the same arithmetic as a monthly stock movement: expected closing stock is opening stock plus receipts minus shipments plus restocked returns minus write-offs already recorded. Shrinkage is the difference between that expected number and the physical count - anything not already accounted for by a movement you've logged.
Run this periodically, not just once - a single large shrinkage number is worth investigating for a specific cause (a bad receiving process, a high-theft SKU, a miscounted location), while small, consistent shrinkage across many SKUs points to a systemic counting or process issue instead.
How to create an inventory report
- Choose one decision. Start with a stock check, replenishment review, or valuation.
- Set the scope. Select the locations, products, reporting date, and sales period.
- Choose the fields. Keep SKU and variant identifiers; add the quantity and cost or sales columns needed for that decision.
- Validate a few rows. Compare them with source records. Check quantity states, missing costs, and whether joins or grouping repeat the same stock.
- Save a repeatable view. Record filters and assumptions so the next review uses the same definitions.
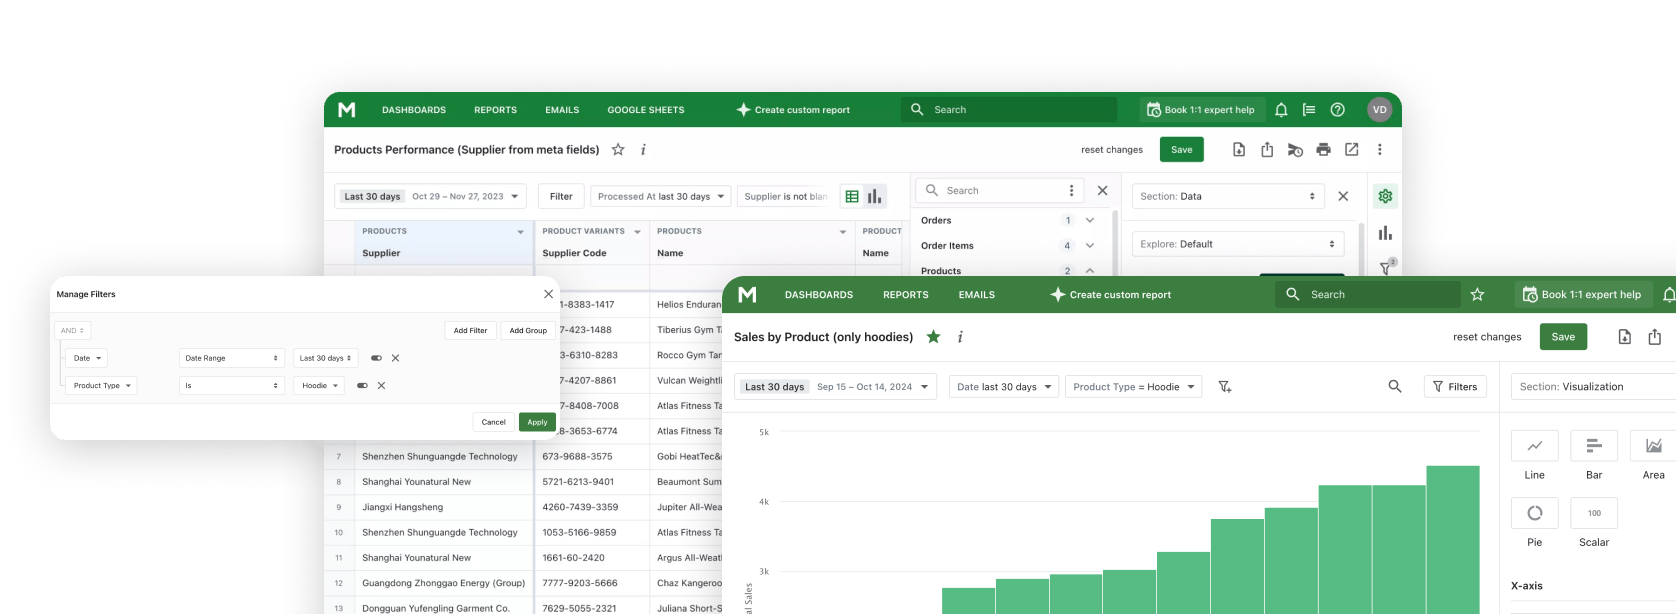
In Mipler, start with an inventory report template and adapt the fields and filters to the question. The examples above show the kinds of stock, planning, and analysis tables you can use. If you need help choosing a view, bring the specific question and a sample of the expected result to the team.

Choose the report that supports your next decision
Use a stock report for today's availability, a value report for quantities at cost, and a planning report for replenishment. Add sales analysis and monthly comparisons when you need to understand demand or changes over time. In every case, the reporting date and field definitions matter as much as the total.
Frequently asked questions about inventory reports
How do you write an inventory report?
Choose the reporting date and locations, then list each product or variant by SKU with a defined stock quantity. Add unit cost and total value for valuation, or sales and lead-time inputs for replenishment. Check sample rows against source records before sharing the report.
What does an inventory report show?
It shows stock quantities for a defined scope and date. Depending on its purpose, it may also show locations, costs, sales, stock movements, or replenishment estimates. Always check whether its quantity is available stock, on-hand stock, or a historical balance.
Which inventory reports should I start with?
Start with current stock by SKU and location, inventory value at cost, and a replenishment review. Add ABC analysis for sales prioritization and month-end comparisons for changes over time. The right set depends on your decisions and the data you track.
What is the difference between inventory quantity and inventory value?
Quantity is a count of units. Value applies a monetary measure to those units, such as unit cost multiplied by quantity. State the quantity basis and distinguish cost from retail price so the report's total is not mistaken for sales revenue.