
Mipler Reports vs Report Pundit
Shopify store owners often have limitations with native reporting and trying to find the best Shopify Reports for their stores. That's where custom reporting apps step in. Two standout tools are Mipler and Report Pundit - both powerful but different in their approach to data. This article dives into their key differences to help you decide which fits your business better.
What Are Mipler Reports and Report Pundit?
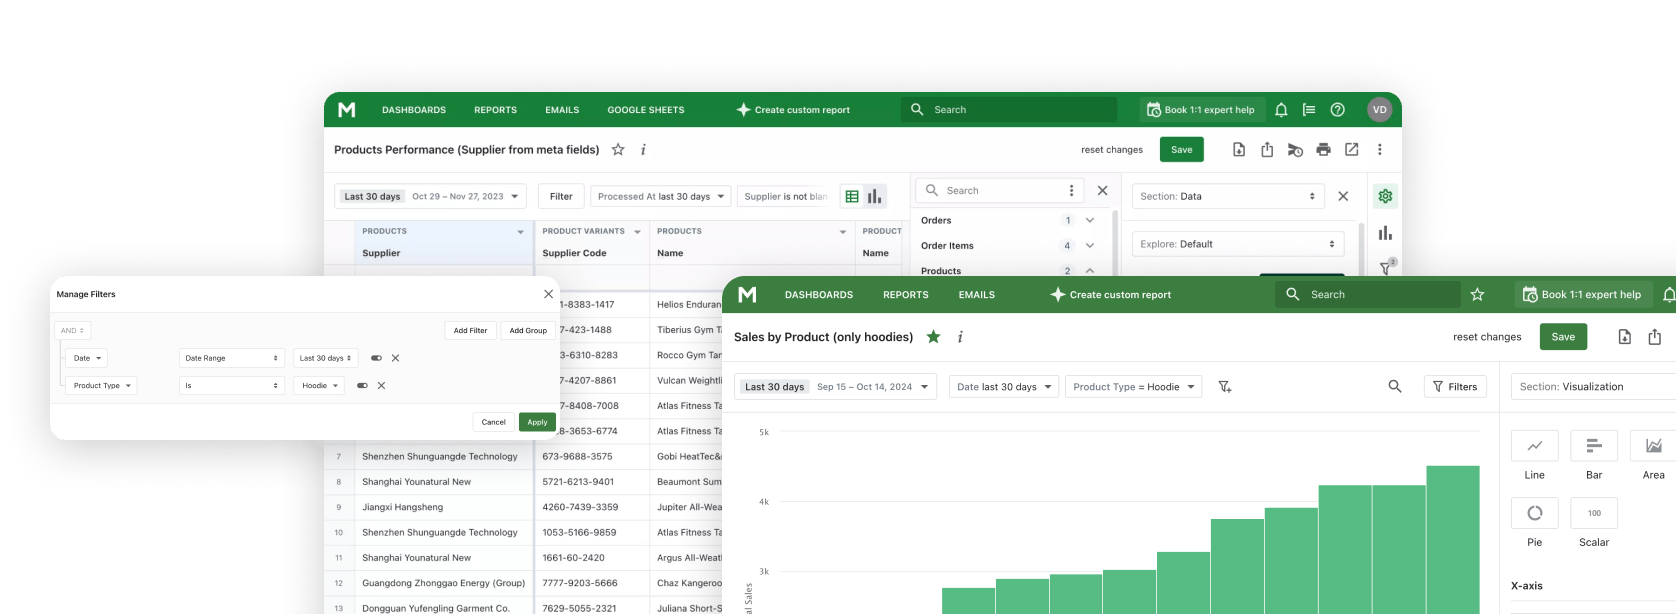
Mipler is an advanced Shopify reporting app that lets merchants build custom reports and dashboards from all their store data. It provides an intuitive interface with drag-and-drop filters, support for tags and metafields, and the ability to export or send data to Google Sheets, Excel, CSV, PDF, HTML or JSON.
Report Pundit (also known as Pundit Reports in the Shopify ecosystem) is another custom reporting tool. It offers detailed reporting via pre-built templates or a report builder. Pundit can access virtually all Shopify data (over 2000 fields) and integrate external data like Google Analytics and Facebook metrics. It supports scheduled exports to Excel, CSV or PDF and unified multi-store reporting for merchants with multiple shops.
Pros and Cons

Flexible Custom Reports (Mipler):
Mipler offers advanced filters and custom formula columns (even a built-in AI assistant) and supports tags/metafields for richer insights. It also provides shareable report links and scheduled email delivery for automation.
Deep Data Access (Report Pundit):
Report Pundit in Shopify gives access to 2000+ Shopify data fields, many pre-built report templates, and integration with Google Analytics/Facebook. It's powerful, though some users find its interface less intuitive and reports take more steps to configure.
Performance & Scale:
Both apps handle large stores, but Mipler's plans start with unlimited orders and dashboards from day one. Pundit's free tier caps at 999 orders, and higher plans impose limits on custom reports. Many merchants report that Mipler's reports run smoothly even on big datasets.
Integrations & Export:
Mipler integrates directly with Google Sheets and Excel, allowing you to share reports via public links. Report Pundit exports only to Excel/CSV/PDF and connects with marketing or fulfillment apps. Both support scheduled reports, but Mipler's standout here is its Google Sheets connector and automatic email attachments.
Product Comparison Table
| Feature | Mipler | Report Pundit |
|---|---|---|
| Custom Reports | Visual drag-and-drop report builder allows creating custom reports with user-defined fields, tags, metafields, and custom formulas. |
Offers custom reports with advanced filters, but no drag-and-drop, requires manual setup, which slows users down. |
| Performance and Scalability |
Unlimited orders on any account tier. Built-in support for multi-store dashboards and API access for advanced automation. |
Free plan is limited to 999 orders. Required a higher and more expensive subscription to remove limits, still lacks API access for automation. |
| Metafields, Tags and Formulas |
Full support for Shopify metafields and tags in formula columns, enabling granular segmentation and custom KPIs. |
Formula setup is less flexible and more complex to configure. |
| Real-time Scheduled Reporting |
Real-time reports inside Shopify admin, automated email delivery, Google Sheets sync, and public report links for collaboration. |
Scheduled exports are available, but no support for public or shareable links. |
| Dashboards and Charts |
Create custom, visual dashboards using drag-and-drop widgets. |
Offers dashboards, but with limited customization. Not enough widget-based layouts and sharing tools. |
| User Interface Ease of Use |
Clean, modern, easy-to-use UI. Drag-and-drop logic makes it ideal for non-technical users. Backed by expert onboarding support. |
Has a high learning curve and requires technical knowledge or support to understand all manual functionality. |
| Data Export Sharing |
Export to Google Sheets, Excel, CSV, PDF, HTML or JSON and insert data into templates. Includes shareable public links and scheduled reports. |
Supports only Excel, CSV, Text, & PDF, no template support and no public sharing links. |
| Support Responsiveness |
Live chat, built-in AI Assistant, dedicated support engineer on higher plans, allows scheduling calls with engineers/managers for onboarding and to help with making reports. |
Offers live chat and report setup help, but no dedicated engineer support or ability to get onboarding/schedule calls with engineers or managers. |
| Plans Pricing |
Free plan includes 100+ reports and daily emails (up to 1000 orders). Paid from $9.99/month with unlimited orders, reports and dashboards. |
Starts at $9/month, but the free plan is capped at 999 orders. Many key features require higher-tier plans up to $60/month (Essential Plus). |
| Historical Product Cost |
Cost is captured when the order is created and stored with it, so COGS, margin and profit for closed periods stay fixed when you update a cost later. Recorded from installation onward. |
Reads the current Shopify cost field. Updating a cost recalculates COGS for every past order. |
| Your Own Data in Reports |
Load your own datasets (ad spend, targets, stock in offline stores, order comments from staff without Shopify access) and use them as fields joined to Shopify data in the same report. |
Connectors to a fixed list of 30+ payment, shipping and marketing apps, with no documented way to load a dataset of your own. |
| Dates in Metafields |
A metafield becomes a real date or timestamp as a field type, with no query language involved: date arithmetic, filters on future ranges, grouping by day, week or month, and use in formulas. |
Metafields work as dimensions and filters. Date logic is possible inside a calculated field, which the documentation says must be written in PostgreSQL. |
| Rating (Shopify App Store) | 5.0 (636+ reviews) | 5.0 (2,030 reviews) |
Historical Cost, External Data, and Dates in Metafields
Historical product cost, not today's cost
Shopify keeps a single Cost per item value per variant and stores no history for it. Every app that reads that field through the Shopify API therefore works out the cost of goods sold for past orders from today's number. Correct a supplier price and last quarter's gross profit moves with it, even though nothing about that quarter changed. Report Pundit reads that same field, so a cost correction rewrites the COGS numbers in reports you have already sent out.
Mipler records the product cost at the moment an order is created and keeps it on that order. A later cost change applies from that point forward and leaves closed periods untouched, so margin, COGS and profit reports for any past month stay reproducible. Tracking begins when you install Mipler: orders created before the install have no cost of their own recorded and fall back to the current Shopify value.
Your own data, reported next to Shopify data
Much of what decides profit never lives in Shopify: ad spend spread across several platforms, monthly targets, stock in an offline store that is not a Shopify location, or order comments written by people who have no Shopify access at all. Report Pundit answers this with a fixed list of connectors, 30+ payment, shipping and marketing apps, which helps when your source is on the list and does nothing when it is not.
Mipler lets you load your own dataset and then use it as an ordinary field in the report builder: join it to orders, products or customers, filter on it, and use it in formulas beside Shopify metrics. That is what makes blended reporting possible. Revenue against ad spend for the same period, actuals against targets, total stock across Shopify and offline locations, or an order list carrying notes from a team that never logs into Shopify.
Dates kept in metafields, treated as real dates
Shopify hands metafield values to reporting tools as text. Getting from that text to a question like "which subscriptions expire in the next seven days" is where reporting apps differ most. Some ask you to pick the right date format by hand and fail quietly when the guess is wrong, some expect the conversion to be written in a query language, and some cannot read metafields at all. Report Pundit does expose metafields as dimensions and filters, and its calculated fields can go further, but its documentation states that the function has to be written in PostgreSQL.
In Mipler a metafield becomes a real date or timestamp as a field type, with no query language involved. From there it behaves like any built-in date field: compare it with today, calculate the difference in days, filter on ranges that sit in the future, group by day, week or month, and use it in formulas and conditional formatting. A few reports this opens up:
- Subscriptions about to lapse. Take the subscription end date from a customer metafield, work out how many days are left, and list every customer whose subscription expires within a week, ready for a reminder.
- Tomorrow's delivery run. Convert the requested delivery date on the order into a timestamp, filter for tomorrow, and aggregate by product, so the warehouse gets one picking list instead of a pile of orders.
- Stock that is about to expire. Read the best before or expiry date from a product metafield, group by the month it falls in, and multiply the quantity at risk by unit cost to see what a markdown decision is actually worth.
- Pre-orders and release dates. Group open pre-orders by the release date held in a product metafield to see what has to ship each week, and how much revenue waits behind each date.
- Warranty and service windows. Add the warranty period to the order date, or read the service due date from a metafield, and pull the customers whose cover ends this month.
- Bookings, rentals and events. Report on the event or rental date kept in an order metafield or line item property: sales by event date, items due back today, occupancy per week.
- Incoming stock. Compare the expected arrival date on a purchase order metafield with current stock cover, and see which SKUs run out before the replenishment lands.
You Do Not Have to Build the Report Yourself
Learning a reporting app is a real cost, and a builder with a thousand available columns is not generous, it is a maze. You have to know that the number you want is called something else here, that it sits on the line item rather than on the order, and that it needs a filter nobody told you about.
With Mipler you can skip that part. Send us the list of what you need in plain words, in whatever form it already exists: a sentence, a few bullet points, a screenshot of the spreadsheet your accountant keeps, or the column headings the warehouse asked for. Our team builds the report, sets up the filters and the calculated columns, and hands it back working inside your Shopify admin. You do not learn a new app, and you do not guess which of a thousand fields is the right one.
After that the report belongs to you. Open it, change a filter, add a column, duplicate it for the next question, or send it back to us to adjust. Live chat is there on every plan, the AI assistant can draft a report from a description, and higher plans add a dedicated support engineer and calls with the people who build the reports.

Why Choose Mipler for Shopify Reports
Mipler's user-friendly design lets store owners build or tweak reports in just a few clicks. It includes an AI assistant and expert support to help create custom reports. Built for scale, Mipler provides unlimited orders and dashboards from the start, so growing stores aren't blocked by hidden limits or higher pay plans. Google Sheets integration and scheduled email reports let teams share insights automatically.
These features, combined with Mipler's modern interface, mean merchants get powerful insights faster, making Mipler a top choice for in-depth Shopify analytics and a strong Report Pundit competitor for merchants needing robust, easy reporting.
Comparing more than two apps? See how Mipler stacks up against five other reporting apps on price, free plans and features. Best Shopify Reporting Apps 2026.