Every store generates a lot of data from interactions with customers.
Shopify’s system records all these metrics, analyzes them, and displays them through dashboards and Shopify Reports. The system automatically generates the fundamental and crucial pre-determined metrics. Platform users themselves can also create additional, more hand-tailored shopify reports and export them.
Mipler has years of experience developing custom reports for Shopify. After analyzing customers' main difficulties when working with Shopify, a guide was created that would answer all questions related to analytics and working with data.
This article is intended to help you understand and use all the varieties of Shopify features and apps developed by Mipler.
What's in Shopify Professional Reports?
There are a few different subscription plans that Shopify offers. Previously, their analytic opportunities varied significantly. However, in 2025, there is little difference between those plans. Shopify and its Lite and Basic editions offer the same reports as Shopify Advanced and Plus. The main difference of the advanced plan is the ability to create hand-tailored custom reports in Shopify. The basic plan does not offer such a useful function.
| Analytics and Shopify reports | Shopify Lite | Shopify Starter / Basic Shopify |
Shopify | Advanced Shopify | Shopify Plus |
|---|---|---|---|---|---|
| Analytics page | ✅ | ✅ | ✅ | ✅ | ✅ |
| Financial Reports (Taxes & Payments) | ✅ | ✅ | ✅ | ✅ | ✅ |
| Fraud reports | ✅ | ✅ | ✅ | ✅ | ✅ |
| Order reports | ✅ | ✅ | ✅ | ✅ | ✅ |
| Live View | ✅ | ✅ | ✅ | ✅ | ✅ |
| Acquisition Reports | ✅ | ✅ | ✅ | ✅ | ✅ |
| Inventory Reports | ✅ | ✅ | ✅ | ✅ | ✅ |
| Behavior Reports | ✅ | ✅ | ✅ | ✅ | ✅ |
| Marketing Reports | ✅ | ✅ | ✅ | ✅ | ✅ |
| Shopify sales reports | ✅ | ✅ | ✅ | ✅ | ✅ |
| Retail sales reports | ✅ | ✅ | ✅ | ✅ | ✅ |
| Profit reports | ✅ | ✅ | ✅ | ✅ | ✅ |
| Customer reports | ✅ | ✅ | ✅ | ✅ | ✅ |
| Custom reports | ➖ | ➖ | ➖ | ✅ | ✅ |
Custom reports provide features like:
- Tailoring the shopify sales report for certain needs. For example, to see sales report only for a specific parameter, such as a collection or a location.
- Creation of reports for different departments. Say a certain manager works with one manufacturer, product type, or delivery point. Others can work with different ones so everyone can have their report.
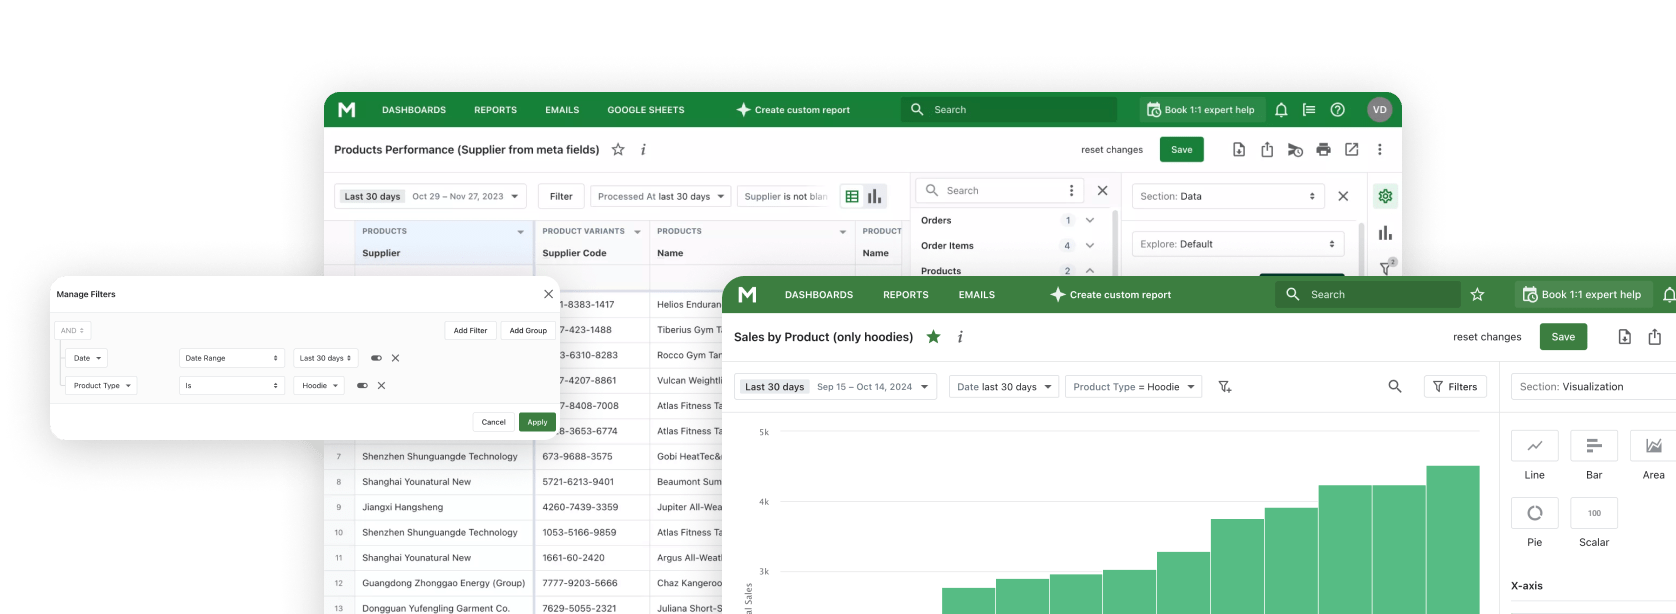
However, even Shopify's custom reporting capabilities are limited, so you often have to design reports for your needs. In this case, Mipler offers services by guaranteeing significant advantages of the generated Shopify advanced reports even over Shopify's custom reports.
Mipler can help you manage your store better than Shopify using custom reports. Here are some examples:
- When the store works with goods with a limited shelf life, orders are often placed on different days and have the same delivery date. Mipler can offer to build a product report, which is unavailable in Shopify reporting, and apply a filter by delivery date, thus showing only those products and their quantities that will be needed tomorrow. Thus, manufacturers can manage how much and what kind of product must be produced tomorrow.
- Stores that sell personalized products (engraving a name on a bracelet, inscriptions on T-shirts, etc.) often need to be able to record some individual characteristics, not only the ordered product. Mipler can generate the report about products and its metrics and details.
- Many stores have several locations where they offer their treats. It is very important to maintain product availability in two locations. Mipler reports allow you to create a special column indicating how many product units need to be moved to another location.
Most Important Business Metrics for Shopify
Monitoring the overall business growth dynamic can be challenging at times. To do so, store owners need to inspect various indicators and metrics. It is easy to distract yourself with the work of individual parts of the shop, but they won’t paint the bigger picture.
Some metrics, however, give a clearer overall picture of performance. They provide critical insights for business growth. Using them may result in more revenue and innovative, data-backed decisions. This part of the article will describe Shopify's most important business metrics.
Sales conversion rate (CVR)
One of the most crucial parameters for any business is the conversion rate. It is calculated from the number of visitors who bought items out of the total number of visitors from the website.
When conversions stay at a certain fixed level, it is normal. The best situation is if conversions increase over time. Significant drops in conversions signal problems with the website. It might be a good sign to ensure your site works properly.
Here is the formula for this metric:
CVR = [# of Purchases] ÷ [# of Sessions]
Usually, the report shows a certain coefficient value as a result. If it is more convenient for the user to use the percentage ratio, the result is multiplied by 100.
Average order value (AOV)
This metric helps to assess users’ paying capabilities. You can set realistic expectations for new customers and adjust your strategy, knowing how much clients can spend.
Here is the formula for this metric:
AOV = [Total revenue] ÷ [Total Number of Orders]
Average order value shows business owners how much, on average, customers spend on one order.
Customer lifetime value (CLV or CLTV)
Customer lifetime value describes the total revenue a business could expect from a single customer during their lifetime. The lifetime in question is when the user will consistently shop at your store.
This metric helps business owners analyze the value of a customer to business. With it, you may determine how much you can safely spend on customer acquisition and still make a profit.
Here is the formula for this metric:
CLV = [Average Value of a Purchase ] × [# of Times the Customer Will Buy Each Year] × [Average Length of the Customer Relationship (in Years)]
Customer acquisition cost (CAC)
This metric lets owners understand how much bringing in a new client costs. It is based on the sums spent on advertising and the number of new clients. Check this parameter regularly to ensure it stays within your CLV or even get closer to it.
Here is the formula for this metric:
CAC = [Amount Spent on Marketing] ÷ [# of New Customers]
Refund Rate
The refund rate is a one-order metric that acts as a quality assurance measure. It shows how often clients file for refunds.
Knowing which products are not meeting customer expectations may be crucial for a store’s growth. Shop owners can remove these products from the catalog, restructure ads, or adjust pricing.
Automatic reports in Shopify
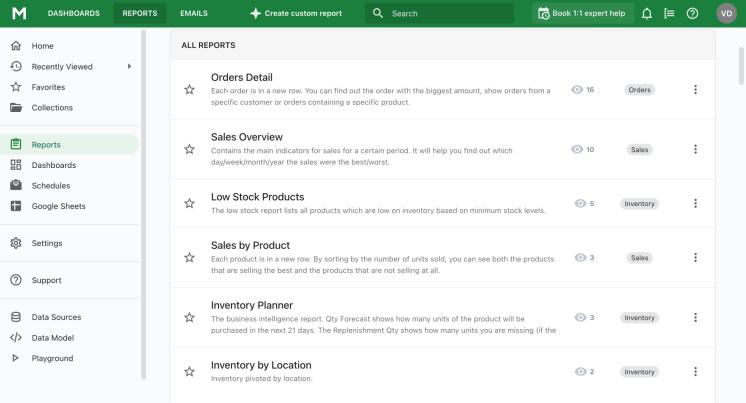
Users of Shopify can grow their stores using tools provided by the platform. One of them is automatic reports. They do not require additional payment to use and pre-build into the system. Store owners can find them in the Analytics department on the Reports tab. Shopify automatically processes the received data and generates reports if the store is already working.
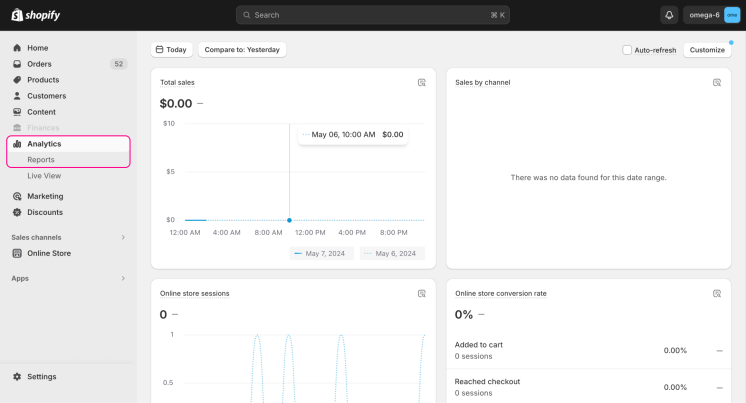
Unlike the general metrics described earlier, the reports consider the store's performance in more detail, from different points of view, and create an overall picture of its effectiveness. Based on the reports, business owners can make thoughtful management decisions based on reliable data.
The reports are divided into categories, so it is clear to the user about which part of the business the information the app will display or export.
Shopify Acquisition Reports
You should work with acquisition reports to analyze data about store visitors over a certain period. The time users spend on the site helps to understand the extent to which visitors are interested in cooperating with the store.
Acquisition reports include the following reports:
-
Sessions Over Time Report
This report shows and analyzes information about the number of visitors and sessions to the Shopify store over a while. Also, the number of sessions is presented on the graph.
-
Sessions by Referrer Report
This report contains information about visitors' sources to enter the store site. It is easy to see if visitors are coming from a search, through a referral, or directly to a store.
-
Sessions by Location Report
This report provides information about the location of visitors who visit the store.
These reports help to increase visitor engagement by understanding where they live and how they interact with the website.
Explore related reports
Shopify Marketing Reports
Marketing strategies work based on how many customers show interest in the product. Reports help you see your progress. You can find out where your sales are coming from, like social media or search engines.
These reports show how many visitors end up buying your goods. They are useful because they give you a clear view of your marketing and where it can be improved. The main benefit of these reports is that they offer deep insight into your marketing efforts and allow you to identify areas for improvement.
Shopify Behavior Reports
Behavior reports are instrumental in comprehending the interaction patterns of customers and visitors. They reveal what customers search for, the pages they visit, and their ease of navigation, among other aspects. These reports provide insights into customer behavior and the store's user experience.
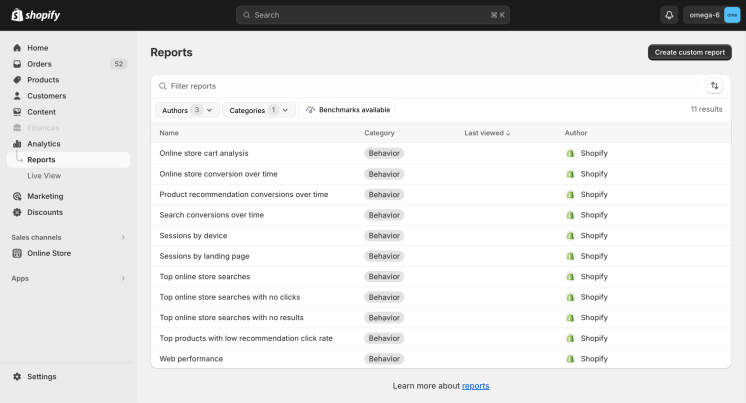
Shopify makes a data import from a store database and offers built-in reports that will show the following:
- The most popular searches and recommendations in online stores. Top online store searches Report, Top online store searches with no results Report, Top online store searches with no clicks Report, Top products with low recommendation click rate Report, Product recommendations conversions over time Report.
- Online Store Conversions Over Time Report. Business owners should use this report to explore the session's performance during which store visitors made a purchase (regardless of purchase size).
- Information about sessions and their results. Sessions by device Report, Sessions by landing page, Search conversions over time.
- Online Store Speed Reports. Business owners should use it to monitor how the store performs when visitors use it. Website speed is one of the important things that can help increase the ranking of your store in the eyes of the buyer.
- Information about the cart. Online store cart analysis report.
Shopify Order Reports
These reports provide information about orders placed in the store. The entrepreneur will be able to import the data from his store and monitor the status of orders and the state of their execution. Reports included in this category:
- Product Orders and Returns Report. These are your best sellers and products that get returned more often.
- Fulfillment, Shipping, and Delivery Times. Reports that show fulfillment, shipping, and delivery times details.
- Shipping labels. The details about shipping labels.
- Order overtime report. Orders received at a particular time frame.
Shopify Finances Reports
Financial reports import the data from the store database to deliver insights on payments, sales, actual profits, accounting, and liabilities. These reports offer critical data on net sales, shopify gross sales, returns, and discounts used during checkout. They also provide details on the store's payment transactions over specific periods and other vital information concerning cash flow.
In general, all financial reports can be divided into categories depending on what they describe:
- Income - Total sales Shopify Report, Gross profit, Gross sales report, Shopify Net sales report
- Sales - Total sales Report, Sales over time Report, Gross sales report, Net sales report, Net sales with cost, Net sales without cost.
- Liabilities - Discounts, Gift card sales report, Gift card balance.
- Goods - Cost of goods sold Report
- Payments - Payments, Payment by type, Gross payments by month
- Shipping report
- Returns report
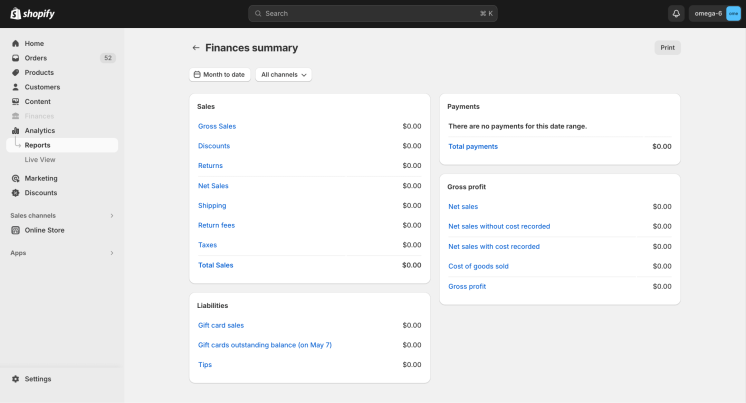
- The summary report - Shopify Dashboard that displays the most needed information about finances. This report is shown in the picture below.
Shopify Profit Reports
To analyze products that are making revenue, you should learn Profit reports. Shopify automatically calculates the profit made on selling goods. Business owners should only enter their cost and price when items are added.
Shopify offers these reports:
- Profit by product report - Shopify sales by product shows products, profit made on selling them, and margin.
- Profit by product variant SKU - is more detailed sales by product Shopify report because each product variant shows profit.
Shopify Sales Reports
Product sales information should be presented as a separate type of report that would help business owners track customer orders. The difference between Shopify Sales Reports and Order Reports is that They describe not only the order itself but also what discount was received, how much profit the purchase made, how much shipping cost, and how much the returned orders cost. It is comfortable to watch a dashboard on sales information filtered by different criteria in reports:
- By Billing location
- By Channel
- By Client name
- By Discount
- By Item
- By Item variant SKU
- By Item vendor
- By Traffic referrer
- Sales over time
- Average order value over time
Also, reports display or export key metrics such as average order value, gross sales, and net sales.
Shopify Customers Reports
Understanding your customers lets you adapt the store to their requirements. By tracking the frequency of purchases, it is easy to evaluate the purchasing power of users and adjust your business development strategy based on the behavior of visitors. Shopify Customer reports display and export information about users, their location, and how often they visit the store.
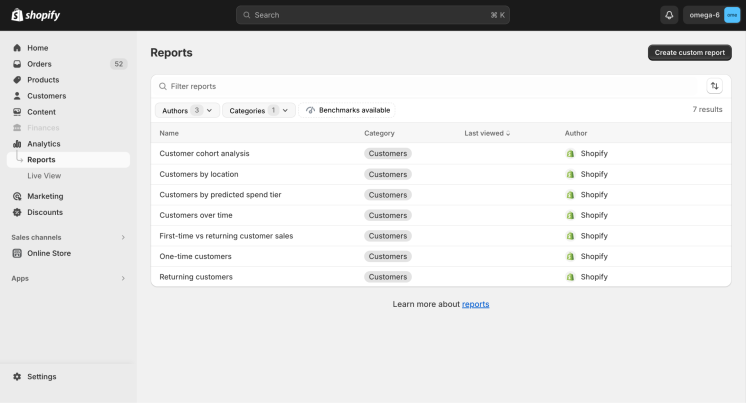
Reports proposed by Shopify:
- “Customer cohort analysis”;
- “Clients by location” helps to analyze which regions the store is more popular in and adjust the business strategy to the specifics of this territory;
- “Clients by predicted spend tier” shows how much the user has already spent in the store and predicts how much more he can spend;
- “Clients over time”;
- “First-time vs returning customer sales” shows the ratio of users who used the store's services for the first time and those who returned;
- “One-time customers” shows how much users spent on their first purchase in the store. This report allows you to understand how high the store's reputation is among visitors;
- “Returning clients”.
Shopify Tax reports
Taxes are an important part of all businesses, so Shopify offers two tax reports for the USA and all other countries. The store owners are responsible for filing and remitting taxes for business. Shopify won’t do this by itself. But reports will help keep track of the amount needed to pay the government.
Tax reports are a type of Financial report, so they are available in Analytics => Finances.
Before generating Tax reports, business owners should set up general information about levies: click “Settings” in the bottom-left corner and then click “Taxes and duties”.
Shopify Inventory Reports
Shopify Inventory Reports are essential for monitoring the shop’s inventory. Reports from Shopify can help you identify goods that need restocking, find items with higher sales, and develop strategies for optimal inventory management.
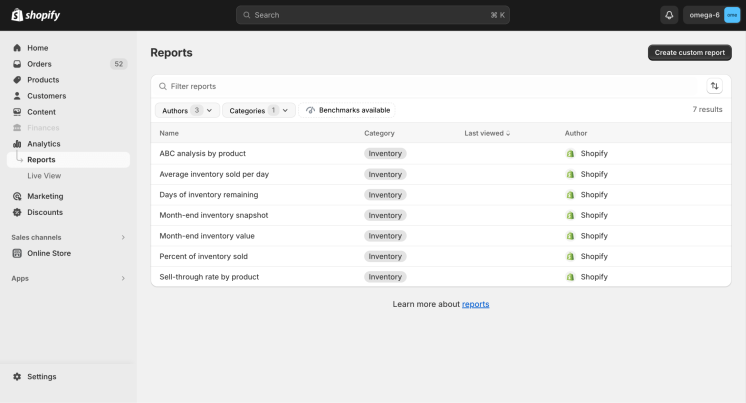
- Average Inventory Sold Per Day. It shows the average number of goods sold daily from the store’s inventory;
- Month-end Inventory Snapshot. It shows the amount of each item variant remaining in inventory at the end of the month;
- Product Sell-Through Rate. It helps owners understand how many items from inventory were sold during a certain time frame;
- Days of Inventory Remaining. It estimates how long the current inventory is expected to last. The result is based on your average sales figures for each option and how much inventory you have left;
- Percentage of Inventory Sold. It shows the percentage of each product option sold from the total stock quantity;
- ABC Analysis by Product. It uses the Pareto principle to place products into three categories based on popularity.
Meanings and Formulas in Columns
Each report presents information in tables. Columns have their name, which describes what data are below. But that is a problem when the column name is an economic term, and the user can’t understand what it means.
The table below lists the terms, meanings, and formulas calculated to find the value specified in the column name.
| Term | Meaning |
|---|---|
| Gross sales |
Equals to product price x quantity (before taxes, shipping, discount, and
returns) for a collection of sales, including canceled, pending, and updating
orders (not including test and deleted orders)
|
| Order | The number of orders that were pleased on a given date |
| Gross profit |
Total profit made on the product during the period of the report. Equals net sales -
product cost.
|
| Net sales |
Equates to gross sales - discounts - returns.
|
| Returns | The number of goods which were returned |
| Discount |
Equates to line item discount + order level discount share for a collection of
sales.
The total dollar value reduction is applied to a sale through discounts on specific products, collections, or all products. Discounts that are applied to all products in an order are proportionally applied to the sales for the order. All discounts are applied before taxes. Discounts are created using discount codes, not the compare-at price. |
| Shopify total sales |
Equates to gross sales - discounts - returns + taxes + duties + shipping
charges.
Total sales is a result Shopify sales in a form of a positive number for a sale on the date an order was placed and a negative number for a return on the date an order was returned. |
| Average order value |
Equates to gross sales (excluding adjustments) - discounts (excluding adjustments) /
number of orders. Adjustments include all edits, exchanges, or returns that are
made to an order after it's initially created.
|
| Shipping | Equates to shipping charges - shipping discounts - refunded shipping amounts. |
| Duties | The total amount of duties in orders |
Why do built-in Shopify Reports can't satisfy all needs?
Built-in sales report Shopify have limited capabilities. There may often be situations where the information these available reports provide is insufficient to meet business needs. It happens because a report Shopify provides is not flexible enough. It provides limited opportunities for individualization and adaptation of Shopify sales data.
Mipler brings innovative methods to developing business reporting solutions with its extensive experience crafting Shopify custom reports. It can create a specialized report, a specialized column in an existing report, and a dashboard. Mipler available reports have the following advantages:
- Mipler lets you see how the report works, even if you have not entered your data. The report will be built on test data, and you will be able to see how it works and what information it can display and export. Shopify allows you to view available reports only if the store is already running and has a certain amount of data to process.
- You can rank the most popular products in each store region based on the same classification.
- You can set up an alert if a customer needs something unusual, like size 47 shoes. When the product they need arrives at the warehouse, you can inform the customer and invite them to check it out.
- Mipler can make available reports that automatically sort customers based on things like what they buy, how often they use the site, and how much they've spent. It can put them into groups like loyal customers (Gold Customers), regular customers, possible regular customers, customers who only ordered once, and customers who haven't started buying yet.
- Mipler reports allow you to create, calculate the ratio of products sold to returns, and analyze which products are returned more often and why.
The main advantage of the reports developed by Mipler is that any report can be created or adapted to the customer's needs. Also, Mipler can offer personal, non-standard, and useful solutions to meet the user's needs.
Conclusion
Shopify is a premier platform assisting in managing and operating online stores. The Report module greatly simplifies the owners' ability to track business progress, analyze metrics, see business strengths and weaknesses, improve site performance, and plan store strategies.
Various report types describe different aspects of the business. Owners use Acquisition, Customer, and Behavior Reports to understand visitors’ needs and preferences and analyze their behavior. Reports like Finance, Profit, and Sales from Shopify show how much money the store is making. Stores need to get new customers, so they need to check how well their marketing is doing and change their plans to meet market needs. Marketing Reports help managers do this. Order Reports mix the store's money matters with what users need and check which products are popular. On the other side, you have stocks that you need to sell. Inventory Reports help manage these stocks and warehouses and keep track of all products.
Nevertheless, Shopify's reports have some limits. There's a need for special reports to meet store owners' needs and his plan for data analysis fully. Mipler creates these reports and has lots of experience. Mipler makes it easy and quick for business owners to look at and use their store's data differently. It helps stores do better by analyzing data well and makes working with reports easy, even for people who need more experience.
