

If you've ever wondered whether some products in your catalog are quietly doing more to create repeat customers than others, you're not alone - it's a question merchants bring up regularly:
I wonder if certain products result in a customer not becoming a repeat buyer or the other way around.
For the store-wide version of the same idea, see our breakdown of metrics every Shopify store owner should track.
Here's how to actually go about answering it for your own store - and, just as important, an honest account of what it takes to build and what it can and can't tell you.

The logic: what the report actually looks at
The idea, in plain terms: look at every customer's first order, but only for customers who already placed a second order. Then count which products show up most often in those first orders. Sort by frequency, and you get a ranked list of the products that most commonly appear in the first purchase of people who came back.
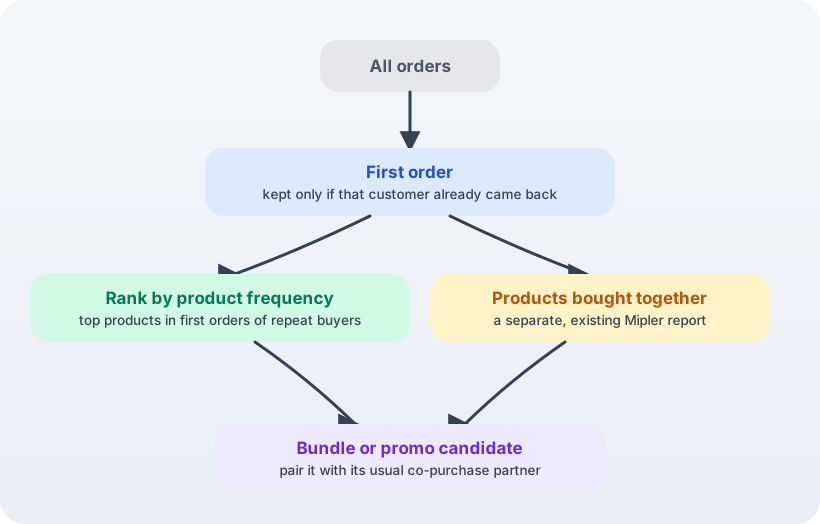
That's step one. Step two is where it becomes actionable: cross-reference that list with a separate products-bought-together report for a single order. If a product that shows up often in repeat customers' first orders is also frequently bought alongside a specific second item, you've got the makings of a concrete bundle or promotion - pair those two products together and use it as an acquisition offer, not just a retention curiosity.
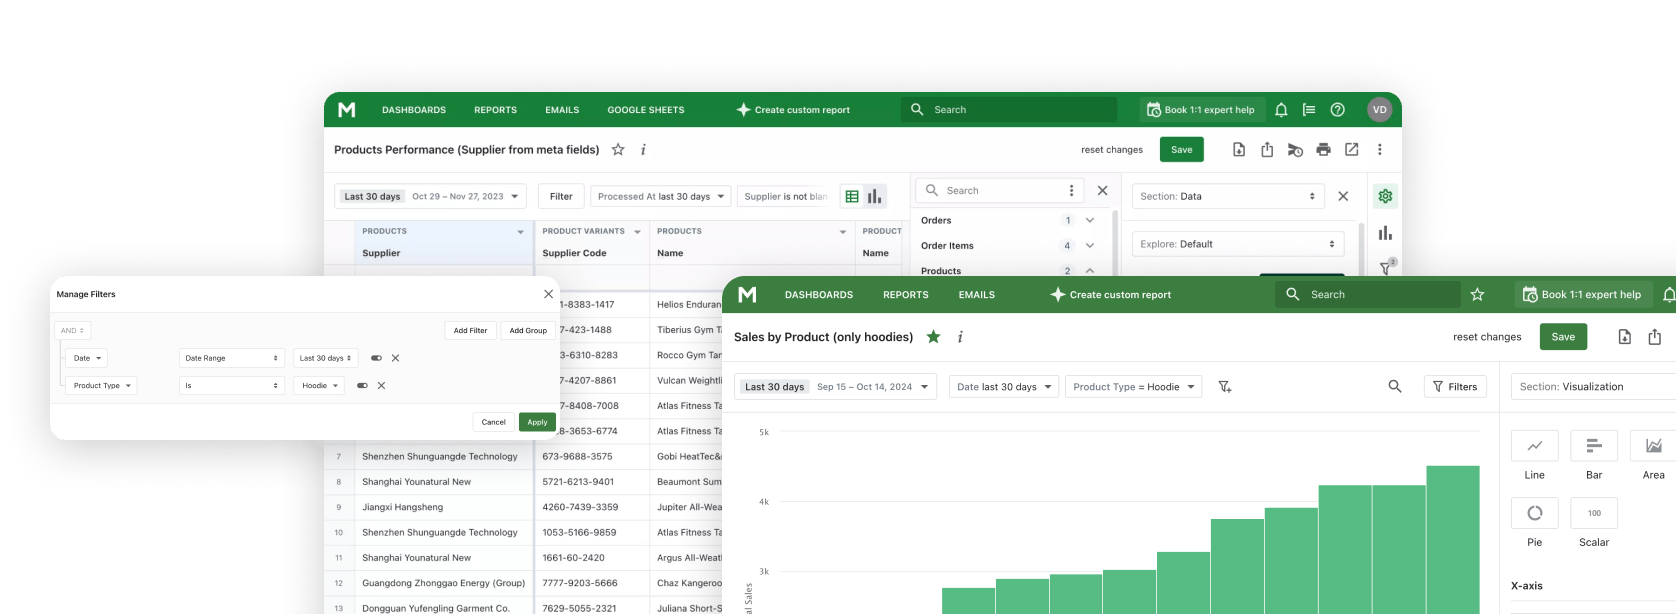
This is a report built in Mipler's custom report builder, joining orders, customers, and products - similar in spirit to a sales-by-customer report, but narrowed down to first orders and filtered to "has a second order," then sorted by product frequency. It's the kind of analysis that's only possible because the data can be joined across those tables in the first place, rather than pulled from a fixed catalog report. It also assumes the underlying data is structured enough to join in the first place - if product attributes live in tags rather than fields, see Shopify Metafields vs. Tags before you try to build this.
Setting this up in Mipler
This isn't a report that comes pre-built anywhere in Mipler, and it isn't a small tweak to an existing template - it's a custom report across orders, customers, and products, filtered down step by step as described above. That's exactly what Mipler's report builder is for: bring the logic, and Mipler's team will set it up for your store, matched to your own product catalog and order history. You're also welcome to build it yourself through the no-code report builder, with help from Mipler's built-in AI Assistant if you want it - either way starts from the same steps:
- Open the report builder.
- Join orders, customers, and products.
- Filter to first orders.
- Filter again to customers with two or more orders.
- Sort by product frequency.
What tends to show up
Based on practical experience rather than a single study, the products that tend to show up in this report fall into two general patterns.
Trending products
Items that are getting attention online at the time - a wave of interest that pulls in new customers who then come back once it's clear the product delivers.
Consumables and repeat-need items
The kind of product a customer runs out of and buys again as a matter of course, independent of any loyalty to the brand.
Neither pattern is a surprise once you see it, but you generally can't tell which of your products fits that description just by looking at your catalog. You have to run the report.
A signal to act on, not proof of cause
It's tempting to read a result from this report as "this product creates loyal customers." Resist that. A product that shows up often in first orders of repeat customers might just be trending, or might be something people restock regularly regardless of anything about their relationship with your brand - correlation here isn't causation, and the report can't distinguish between the two.
What it is, more reliably, is a signal for where to focus next - and there's more than one way to act on it. A promotion is the obvious one: put the product on sale and give customers a reason to buy now, with a good chance they come back hoping for that same deal again. But the same signal points to other moves too - launching an improved version of that same product, aimed at winning those same customers back again, or targeting customers who haven't bought it yet with a dedicated email or campaign, since it already has a track record of turning first-time buyers into repeat ones.
Treat the report's output as a starting point for decisions like these, not as a verdict on which products are secretly building loyalty. That's a more modest claim, but it's the one the data actually supports.
Explore related reports
Where to go from here
If you're already running Mipler and want to see this for your own store, bring the logic above to Mipler's team or AI Assistant, and they'll build it for your data. What you get back won't tell you which product made someone loyal. It'll tell you which products are worth building your next promotion, product update, or win-back campaign around - and that's the more useful question anyway.
FAQ
How many repeat customers do I need before this report is meaningful?
There's no fixed threshold. If your store only has a handful of repeat customers so far, the ranking will be noisy - a single order can shift a product to the top. The more repeat customers you have, the more reliable the pattern becomes.
Can this report tell me why customers came back?
No. It tells you which product was in their first order, not what made them return. Correlation isn't causation here - see the caveat above.
Should I bundle the top product with something else?
Only if it also shows up often in the products-bought-together report alongside a specific second item - that overlap is what turns a frequent first-order product into an actual bundle candidate, not the ranking on its own.
How often should I re-run this report?
Whenever your catalog or customer base shifts meaningfully - after a promotion, a new product launch, or roughly every quarter. Repeat-purchase patterns move as your store does.
What if my top result is a cheap loss-leader product?
That's a real possibility, and it's exactly what the correlation-vs-causation caveat is about - a low-margin product can rank high here without being a good promotion candidate on its own. Check it against margin, using something like the Customer Lifetime Value report, before building a campaign around it.