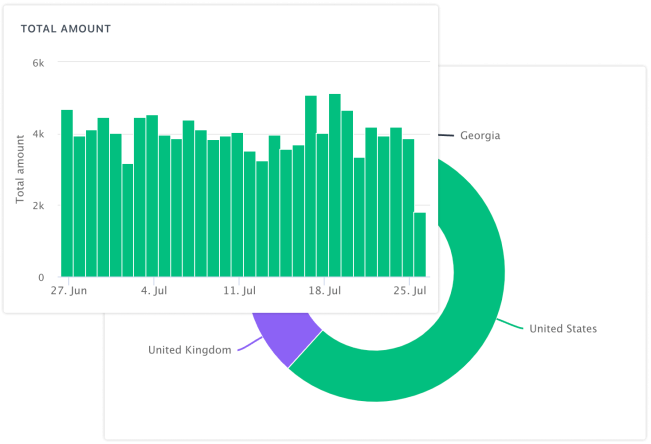
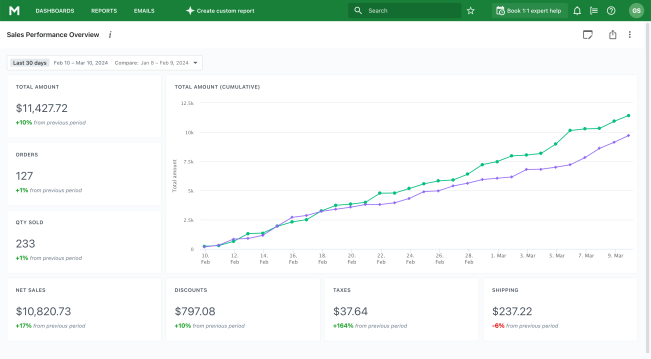
Track necessary store KPIs and adjust metrics and charts per your needs.
Shopify dashboard is an essential tool for your store. It helps you track sales, provides useful data analytics, and allows you to overview information in a bundled-up template. Data is an important resource for any eCommerce. Utilizing it, you can adjust your marketing and increase store sales. Your KPIs tell you a lot about the efficiency of your Shopify store.
Add new metrics, charts, and tables that are useful for you with a few clicks. You can customize your dashboard to your taste and preferences. Our Shopify dashboard allows you to edit the layout, swapping, adding, and removing blocks. You decide what analytics you need to see on your dashboard. You may need to see sales by country, list of unfulfilled orders, or monitor data about taxes. Customize your dashboard to gain maximum profit from the provided data.
Create custom filters for each block or for all blocks at the same time. You may customize data filters for the blocks of your dashboard. After the installation, you can access standard data filters, like date, price, and others. However, there is also an opportunity to create custom filters to gain more fine-tuned analytics to benefit your eCommerce.
Examples: see the sales in a certain region that exceed the set price, discover how tax affects orders’ size, etc.

Add as many dashboards as you need: sales overview, product performance analysis, accounting, customers, and more. Sometimes, all the needed data cannot fit into one dashboard. What is the point of a dashboard if you need to scroll and search for needed analytics? Our app allows you to create several Shopify dashboards with different templates. You may customize each template to your liking.

Drill down from aggregated metrics to detailed data that clarifies the whole picture. Use filters, sorting, and data periods to get detailed information about your Shopify store. Analyze your KPI and find out how you can enhance your marketing. For example, track sales flow in precise periods, like holidays.

Comparison is the easiest way to understand the health of the business.
Create a Shopify dashboard template that will help you to overview and compare different periods of activity for your store. Compare analytics of different time periods to see if changes to design, sales, or dates are affecting your sales.
Change your Shopify marketing strategy using information from the dashboards.
A dashboard typically includes a set of various metrics that allow for a quick overview of the current situation without diving into detailed reporting.
Unlike Shopify’s built-in dashboard, Mipler provides the flexibility to create different dashboards tailored to specific needs. These can range from dashboards displaying current sales figures to analytical dashboards that aggregate data over extended periods.
Additionally, you can set up metrics to describe the current inventory status, low-stock products, and more.
The key advantage is the ability to create different dashboards for various tasks.
By default, we already offer dozens of different metrics. Additionally, any existing report can be added to the dashboard as a table, chart, or a single metric.
On your dashboard, you can add blocks with different types of information and filters. Thanks to the simple and intuitive interface, all dashboard settings can be configured quite quickly.
Creating a new dashboard takes just a few minutes. You can either copy an existing dashboard and modify it, or build one from scratch.
In both cases, you simply choose the information blocks you want to display and how to filter the data. Over time, as needs change, dashboards can be updated with new blocks, rearranged, or even split into multiple, more specialized dashboards.
By default, Shopify provides a dashboard for its users with all the general metrics and the option to add more. However, this functionality doesn’t always meet all business needs, as different people or departments use different metrics for their work.
Therefore, the ability to create multiple dashboards is essential. With custom dashboards, you can create a configuration that perfectly fits your store’s needs.
A dashboard operates with blocks, and these blocks can display different types of information. Essentially, a single metric or table is simply a report in a different format.
On the Shopify dashboard, you can add metrics/reports, set their size, position, and interactions with other blocks.
You can add various types of filters (by date, tags, product, etc.) to each dashboard and then set a connection between the filter and individual blocks/reports. This way, when a dashboard-wide filter is adjusted, the data in the blocks will also update to reflect the filter's value.
We provide the ability to export individual Shopify reports from the dashboard. Additionally, you can enable extended access to the dashboard via a unique link, allowing anyone with the link to view the dashboard's content.
Dashboards are used in many types of businesses, and Shopify stores are no exception. A well-configured dashboard can save you hours of work time over the course of a month.
It is worth noting that our dashboards are fully integrated with our Shopify custom reports and can display both simple Shopify sales reports and more complex reports, such as the Shopify inventory planner report.
Join Mipler now and benefit from meaningful reports today