
Mipler Reports vs Easy Reports
Running reports on your Shopify store should be easy, not a chore. Built-in analytics from Shopify itself are often limited, so merchants need flexible apps for easy reporting. Two popular Shopify reporting apps are Mipler and Easy Reports. This article explains each tool and highlights why Mipler stands out for store owners who want powerful, customizable insights.
What Are Mipler Reports and Easy Reports
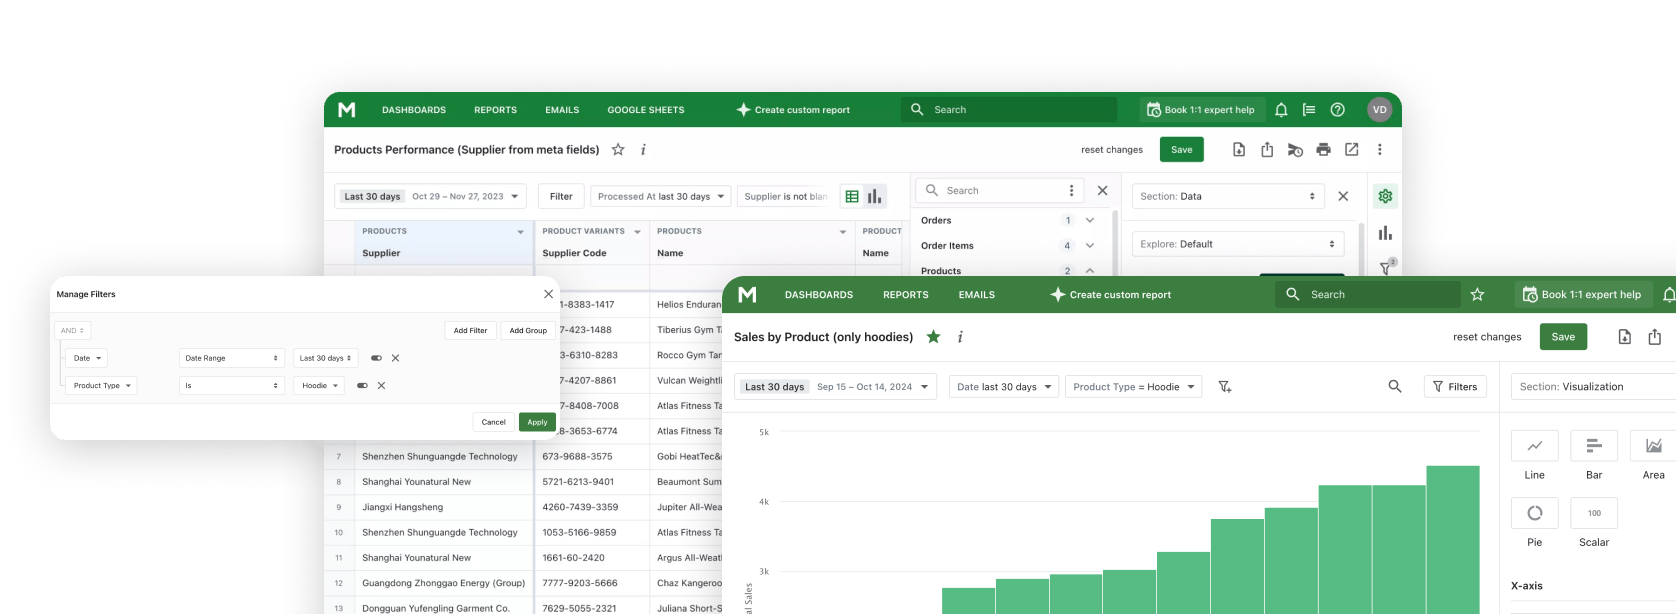
Mipler is an advanced reporting platform built for Shopify. It lets you create, customize, and automate any report you need. With over 100 built-in templates and custom columns, Mipler turns any store data (including products, orders, customers, tags, and metafields) into clear reports, or dashboards. You can filter, group, and even use formula-based columns. Mipler also integrates with Google Sheets or email and has an AI assistant which can help generate reports.
Easy Reports by DevCloud focuses on basic but easy-to-use reporting. It lets you pick fields (orders, products, inventory, customers, etc.) and filters to quickly generate the report you need. Easy Reports supports exporting to XLS, CSV, PDF, Excel or JSON and can schedule emails or upload results to Google Drive and Google Sheets. It has a simpler interface for generating easy reports, but it mainly covers core Shopify data and lacks advanced customization.
Pros and Cons
Mipler Pros:
- Mipler wins at custom reports and flexibility. It offers 100+ pre-made report templates, custom formulas, and powerful filters so you can build any report your store needs.
- It supports automated scheduling and sharing (via email or link) and real-time syncing with Google Sheets.
Mipler Cons:
- Because Mipler is highly customizable, it can be more complex to set up than simpler tools. However, you can choose from existing templates, create your own using AI Assistant or ask for help from our engineers.
Easy Reports Pros:
- Easy Reports is simple and affordable. For small stores that need straightforward order, product, or customer summaries, Easy Reports does the job with minimal setup.
- It provides basic scheduling, Google Drive/Sheets exports, and a friendly interface.
Easy Reports Cons:
- Easy Reports is limited in scope. It covers only basic data (orders, products, customers) and offers fewer built-in templates than Mipler.
- There are no dashboards or advanced custom columns. It also has no free tier beyond trial, and it does not support store attributes like metafields or tags. In short, it is less flexible for analytics and lacks high-end customization.

Product Comparison Table
| Feature | Mipler | Easy Reports |
|---|---|---|
| Built-for-Shopify | Meets highest Shopify standards and integrated as an app inside Shopify store | Built for Shopify |
| Pricing/Plans | Limited free plan / trial available | Free for stores with ≤1000 lifetime orders Paid plans from $4.99/month |
| Rating (Shopify App Store) | 5.0 (636+ reviews) | 4.7 (92 reviews) |
| Pre-built Templates | 100+ ready-made report templates | Limited to orders/products reports. Predesigned formats for sales, inventory, customers |
| Custom Reports & Formulas | Full custom columns/formulas | Only basic custom filters |
| Dashboards | Fully customizable dashboards with ability to attach existing reports to it, create new one inside it and gather all information in one report | No dashboards |
| Automation | Built-in reports scheduling which can send specific reports each time period on emails in different formats (CSV, Excel, PDF) or send live report links. | Allows you to schedule reports by email, export or download them in CSV and PDF formats or share them as a live link. |
| Google Sheets Integration | Direct sync to Google Sheets | Upload to Sheets |
| Data Sources (Metafields/Tags) | Supports metafields/tags | No support for tags/metafields |
| Output Formats | CSV, Excel, PDF, HTML, JSON | XLS, CSV, PDF, JSON |
| Support | Live support, customization help, dedicated support engineer on higher plans and ability to create custom reports using AI Assistant | Self-service only |
| Historical Product Cost | Cost is captured when the order is created and stored with it, so COGS, margin and profit for closed periods stay fixed when you update a cost later. Recorded from installation onward. |
Reads the current Shopify cost field. Updating a cost recalculates COGS for every past order. |
| Your Own Data in Reports | Load your own datasets (ad spend, targets, stock in offline stores, order comments from staff without Shopify access) and use them as fields joined to Shopify data in the same report. |
Shopify orders, products, customers and inventory data only. |
| Dates in Metafields | A metafield becomes a real date or timestamp as a field type, with no query language involved: date arithmetic, filters on future ranges, grouping by day, week or month, and use in formulas. |
No support for tags or metafields. |
Historical Cost, External Data, and Dates in Metafields
Historical product cost, not today's cost
Shopify keeps a single Cost per item value per variant and stores no history for it. Every app that reads that field through the Shopify API therefore works out the cost of goods sold for past orders from today's number. Correct a supplier price and last quarter's gross profit moves with it, even though nothing about that quarter changed. Easy Reports reads that same field, so a cost correction rewrites the COGS numbers in reports you have already sent out.
Mipler records the product cost at the moment an order is created and keeps it on that order. A later cost change applies from that point forward and leaves closed periods untouched, so margin, COGS and profit reports for any past month stay reproducible. Tracking begins when you install Mipler: orders created before the install have no cost of their own recorded and fall back to the current Shopify value.
Your own data, reported next to Shopify data
Much of what decides profit never lives in Shopify: ad spend spread across several platforms, monthly targets, stock in an offline store that is not a Shopify location, or order comments written by people who have no Shopify access at all. Most reporting apps answer this with a fixed list of connectors, which helps when your source is on the list and does nothing when it is not.
Mipler lets you load your own dataset and then use it as an ordinary field in the report builder: join it to orders, products or customers, filter on it, and use it in formulas beside Shopify metrics. That is what makes blended reporting possible. Revenue against ad spend for the same period, actuals against targets, total stock across Shopify and offline locations, or an order list carrying notes from a team that never logs into Shopify.
Dates kept in metafields, treated as real dates
Shopify hands metafield values to reporting tools as text. Getting from that text to a question like "which subscriptions expire in the next seven days" is where reporting apps differ most. Some ask you to pick the right date format by hand and fail quietly when the guess is wrong, some expect the conversion to be written in a query language, and some cannot read metafields at all. Easy Reports does not report on metafields at all, so there is nothing here to build on.
In Mipler a metafield becomes a real date or timestamp as a field type, with no query language involved. From there it behaves like any built-in date field: compare it with today, calculate the difference in days, filter on ranges that sit in the future, group by day, week or month, and use it in formulas and conditional formatting. A few reports this opens up:
- Subscriptions about to lapse. Take the subscription end date from a customer metafield, work out how many days are left, and list every customer whose subscription expires within a week, ready for a reminder.
- Tomorrow's delivery run. Convert the requested delivery date on the order into a timestamp, filter for tomorrow, and aggregate by product, so the warehouse gets one picking list instead of a pile of orders.
- Stock that is about to expire. Read the best before or expiry date from a product metafield, group by the month it falls in, and multiply the quantity at risk by unit cost to see what a markdown decision is actually worth.
- Pre-orders and release dates. Group open pre-orders by the release date held in a product metafield to see what has to ship each week, and how much revenue waits behind each date.
- Warranty and service windows. Add the warranty period to the order date, or read the service due date from a metafield, and pull the customers whose cover ends this month.
- Bookings, rentals and events. Report on the event or rental date kept in an order metafield or line item property: sales by event date, items due back today, occupancy per week.
- Incoming stock. Compare the expected arrival date on a purchase order metafield with current stock cover, and see which SKUs run out before the replenishment lands.
You Do Not Have to Build the Report Yourself
Learning a reporting app is a real cost, and a builder with a thousand available columns is not generous, it is a maze. You have to know that the number you want is called something else here, that it sits on the line item rather than on the order, and that it needs a filter nobody told you about.
With Mipler you can skip that part. Send us the list of what you need in plain words, in whatever form it already exists: a sentence, a few bullet points, a screenshot of the spreadsheet your accountant keeps, or the column headings the warehouse asked for. Our team builds the report, sets up the filters and the calculated columns, and hands it back working inside your Shopify admin. You do not learn a new app, and you do not guess which of a thousand fields is the right one.
After that the report belongs to you. Open it, change a filter, add a column, duplicate it for the next question, or send it back to us to adjust. Live chat is there on every plan, the AI assistant can draft a report from a description, and higher plans add a dedicated support engineer and calls with the people who build the reports.

Why Choose Mipler for Shopify Reports
Compared to other Easy Reports competitors, Mipler is the obvious choice when it comes to flexible Shopify reporting. Mipler is a full-featured Shopify Reports tool that offers simplicity and advanced analytics. Mipler was developed with Shopify, and it performs to the highest standards of Shopify. It is more than simple reporting as it allows you to use all the details of a report (add formulas, new columns and use store tags) which is not possible with Easy Reports. As time goes by every store expands and you have to be ready to it.
Mipler grows with your business as well. It has powerful dashboards and 100+ templates that include sales, finances, inventory, etc. Automated scheduling and integration with Google Sheets implies that your team will have timely reports on the schedule. And, Mipler has a responsive support team that can assist in setting up complex reports, on higher plans you will even get a dedicated support engineer to your store.
To sum up, the answer is yes, Mipler is the best solution as easy report alternative to Shopify store reporting. It offers simple reporting with professional flexibility, which makes complicated analyses easy. Mipler is the most intelligent app that store owners should use to get advanced reports, it is indeed the advanced reporting app.
Comparing more than two apps? See how Mipler stacks up against five other reporting apps on price, free plans and features. Best Shopify Reporting Apps 2026.