

Sell-through rate is the percentage of the Shopify inventory you had that actually sold - not just how many units moved, but how much of what you brought in you actually turned into sales.
You pull up your sell-through rate on a Shopify product and it reads 100%. Everything you brought in is gone. The instinct is to call that a win - you read the demand right, you didn't leave a single unit unsold.
Except the same 100% can mean the opposite: you ordered too little, sold out weeks before the season ended, and every day the shelf sat empty was a day of demand you never got to capture. Sell-through rate on its own tells you that supply met demand at some point. It doesn't tell you whether supply ran out too early or landed exactly right.

What Sell-Through Rate Tracks
Sell-through rate is calculated as:
Sell-Through Rate = Sold ÷ (Sold + Ending Inventory)
It connects two numbers: how many units you actually sold, and how many you had available to sell in the first place. That's what makes it different from a raw sales count - 100 units sold means something very different if you started the season with 100 units than if you started with 1,000.
Two Owners, One Number, Two Different Stories
Picture two store owners looking at the exact same result at the end of a season: "we sold 100% of what we brought in."
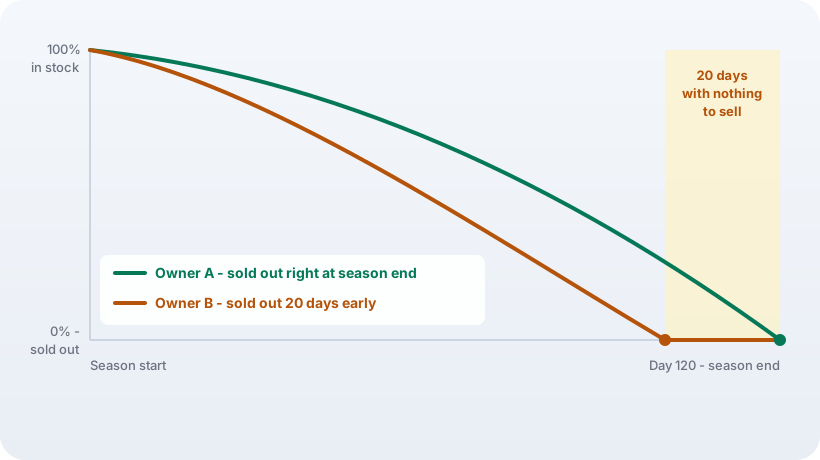
The first one planned it well. They forecast demand, ordered close to what the market would actually absorb, and sold the last unit right around when the season ended. No overstock left tying up cash, no shelf sitting empty for weeks beforehand. That's the buy working as intended.
The second one guessed low. They sold out three, four, six weeks before the season was over, and kept getting asked for a product that wasn't there anymore. Every one of those weeks was lost revenue that never shows up in a sell-through calculation, because sell-through only counts what you actually sold against what you actually had - it has no column for the demand that walked away because the shelf was empty.
Both owners get to write "100%" in the same spreadsheet cell. Only one of them should be happy about it.
Why the Date You Check Stock On Changes the Answer
The part that trips people up is which leftover inventory you use in that formula.
If you check your current stock level right now to work out what happened last month, you get a number that keeps moving depending on when you happen to look at it. Check it in August and you'll get one sell-through rate for July. Check the same calculation in September and it changes again - not because anything about July changed, but because your stock position today isn't the same as your stock position at the end of July.
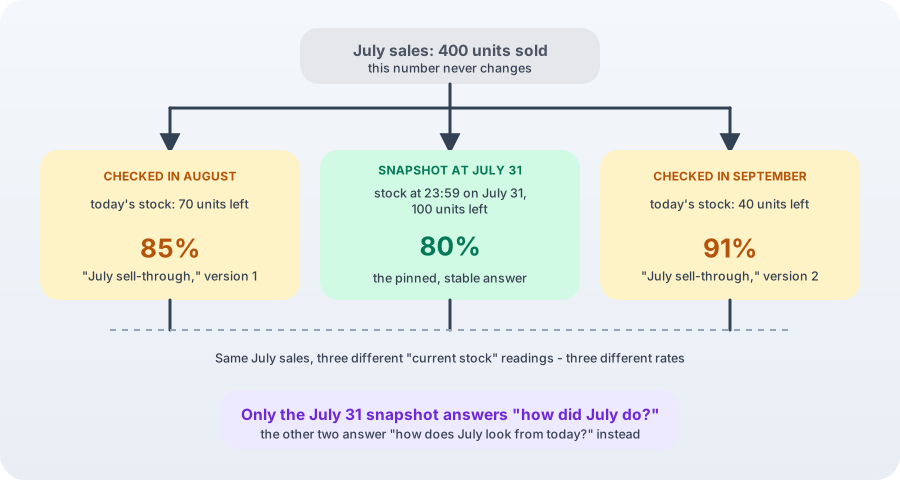
There are actually two legitimate versions of this metric, and they answer different questions. One is historical: how did that specific period perform, using inventory as it stood at the end of that period - a single point-in-time snapshot, not today's number. The other is live: how is the current period trending right now, using today's stock, so you can see the picture as it develops rather than waiting for the period to close.
That's exactly the distinction that matters for the calculation: inventory "as of" a specific date - one snapshot taken close to midnight on the last day of the period, not the sum of every inventory count logged that day, and not whatever the stock level happened to be when the report was run. (For the broader picture of what snapshot and history reports cover in Shopify generally, see our inventory reports overview - this section is about the one specific way that choice affects a sell-through calculation.)
Different teams also mean different things by "sell-through." A buyer asking "did we order the right amount" is really computing sold against what was received for the season. A merchandiser asking "how fast did this move" is computing sold against what was on hand at the start of the period. And "how much of what we ended up with did we actually turn" is sold against what was left at the end. All three need inventory pinned to a specific date to mean anything, not whatever your stock counter shows today.
The Test That Actually Tells the Two Scenarios Apart
The sell-through percentage alone won't tell you which owner you are. You need to look at what happened while the shelf was empty.
- Find the date of the last sale before the product's stock hit zero.
- From that date forward, count how many days the item sat at zero inventory.
- Look at the sales velocity for that same product in the period before it ran out - a trailing window, 90 days is a reasonable default, or whatever window fits your sales cycle.
- Multiply the days-out-of-stock by that pre-stockout daily sales rate - the result is an estimate of the demand that never got captured.
A high sell-through number paired with a long stretch of zero inventory and a solid pre-stockout sales rate is the pattern of an under-order, not a well-timed sellout. A high sell-through number where the last unit moved right around when the season naturally wound down, with no meaningful stretch of empty shelf behind it, is the pattern of a buy that actually worked.
This is a different question from days of inventory on hand, which tells you how long your current stock will last going forward. The test here looks backward, at stock you've already run out of, to size up demand you already missed.
An Illustrative Example (Not a Real Case)
To make the math concrete, here's a made-up scenario - not an actual Mipler customer, just numbers picked to show how the method plays out.
Say a product's last sale before it hit zero stock was on day 100 of a 120-day season. It stays at zero inventory for the remaining 20 days. In the 90 days leading up to that stockout, it was averaging 4 units a day.
| Days out of stock | Pre-stockout velocity | Retail price | Estimated units missed | Estimated revenue missed |
|---|---|---|---|---|
| 20 | 4 / day | $35 | ~80 | ~$2,800 |
That's roughly 80 units of demand that likely existed but was never fulfilled - simply because there was nothing left to sell - or close to $2,800 in sales that a 100% sell-through figure alone would never reveal.
Treat that number as a ceiling, not a measurement. Demand rarely holds perfectly steady for 20 straight days, and in a real catalog some of it quietly shifts to a similar product still in stock instead of disappearing outright. The real figure is probably lower - but the direction and the order of magnitude are what matter for deciding how much more to order.
The point of the exercise isn't the specific numbers - they're invented for illustration. It's the shape of the calculation: days without stock, multiplied by how fast the product was actually moving right before it ran out.
What Mipler Can Show You Today
Already in Mipler
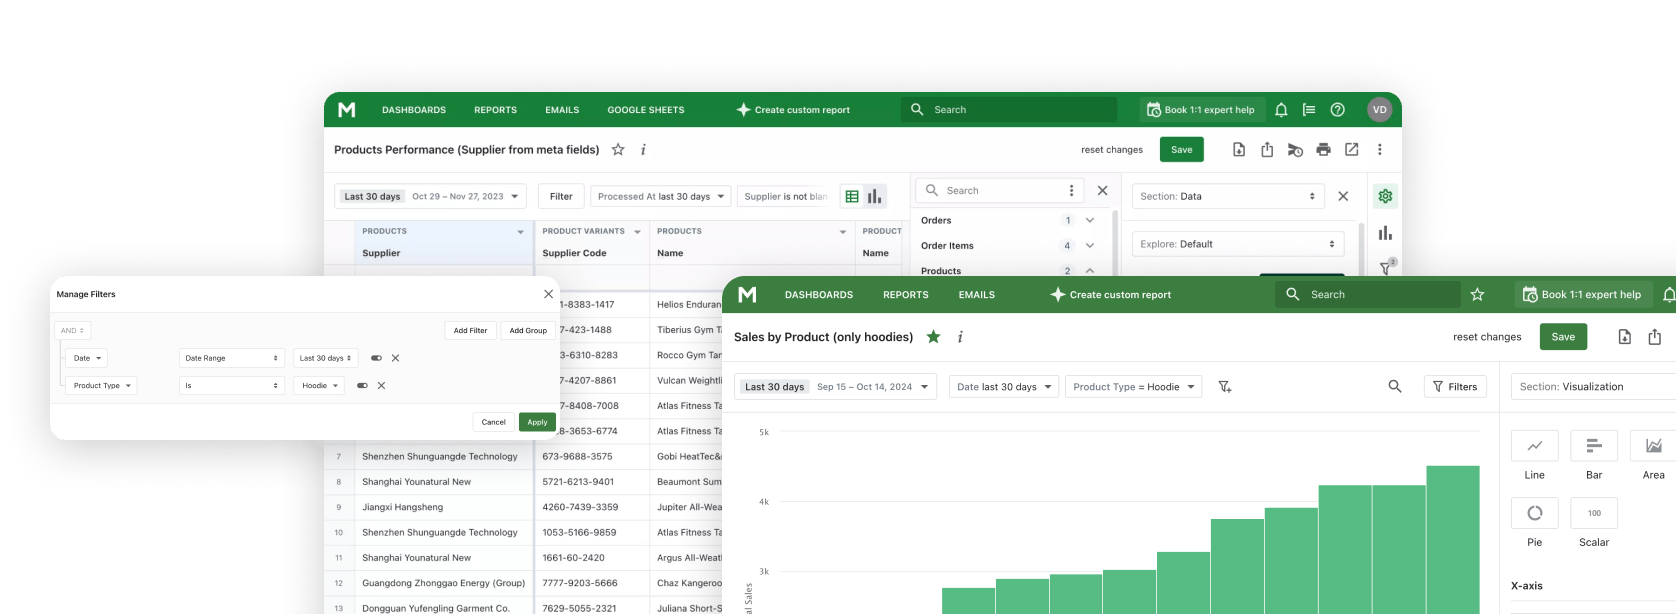
A sell-through rate report Shopify merchants use for exactly this kind of stock-versus-sales view. The linked example runs on a demo store with placeholder data, not a real customer's numbers. If you'd rather assemble the raw numbers yourself in a spreadsheet first, this tutorial walks through pulling that same report into Google Sheets - this article picks up from there, once you have the number and want to know what it's actually telling you.
What We Can Build for You
The "days without stock times pre-stockout sales rate" calculation described above isn't a single pre-built report. Bring the logic to Mipler's team and they'll set it up for your Shopify store, matched to your own product catalog and order history. You're also welcome to build it yourself through Mipler's custom report builder, joining stock levels and sales data for the SKUs you care about - either way starts from the same steps:
- Open the report builder.
- Join inventory and sales data for the SKUs you care about.
- Add a calculated field for days since the last sale where current stock is zero.
- Add the pre-stockout sales velocity over your chosen trailing window.
- Multiply the two to get the estimated demand missed.
There's also a real limitation worth knowing before you go looking for it: Mipler starts tracking inventory history from the moment the app is installed on your store. If you've been on Mipler for a while, that history is there to build the join against. If your store is new to it, there's no historical inventory data from before installation - it simply wasn't being recorded yet.
For a newly connected store without that history, there's still a workable shortcut: check the product's current inventory, and if it's sitting at zero, use the date of its last order as an approximate stockout date. It won't be as precise as a full inventory snapshot history, but it gets you close enough to start spotting which products ran out early and which ones sold through on schedule.
What Counts as a "Good" Sell-Through Rate Depends on What You Sell
None of this replaces the test above - a category benchmark can't tell you whether a specific product ran out early or sold through on schedule, only the days-at-zero test can. What a benchmark gives you is a faster, second-pass read: which general range you should expect to land in before you go dig into why.
As a general rule of thumb, a comfortable sell-through rate sits somewhere around 50-70%. That's not a hard industry standard, and it shifts depending on what you're selling:
- Apparel and fast fashion: 50-70% for the season is a healthy range.
- Electronics and tech: 60-80% is more appropriate, because these products age out of relevance quickly.
- Food and other FMCG: 85% and above, driven by limited shelf life - you don't want inventory sitting around past its useful window.
- Luxury goods: 40-50% is actually normal here, since scarcity and exclusivity are part of the value.
The two ends of the range point to two different problems. A sell-through rate under roughly 40% usually signals overstock: cash is frozen in inventory that isn't moving, and storage costs keep climbing the longer it sits. A sell-through rate over roughly 80% usually signals the opposite: you're running into stockouts, the product is moving faster than you can restock, and you're losing potential profit to unfulfilled demand.
The fix depends on which side you're on. If sell-through is too low, the lever is demand: run a discount, put more marketing behind the product, or revisit the listing itself if it's underselling relative to how much stock is sitting there. If sell-through is too high because you're genuinely running into stockouts, the lever is supply: our breakdown of calculating the reorder point covers the timing side of that decision. Or, if the demand is strong enough that supply constraints aren't hurting the brand, raise the price to capture more margin on the units you do have.
Explore related reports
The Next Time You See Sell-Through Rate = 100%
Pull up the product, check how many days it sat at zero stock before the period ended, and look at what it was selling per day right before that happened. If those two numbers multiply into something meaningful, that's the size of the order you underestimated - and the number to raise before the same season comes back around. Mipler's Inventory Planner report can help turn that number into an actual order quantity, from your own sales velocity and stock coverage. If the shelf only went empty right as demand was naturally winding down, then yes, that 100% really is the win it looks like. The only way to know which story you're in is to check.
FAQ
Is a 100% sell-through rate always a good sign?
No. It means everything you brought in sold, but it can't tell you whether that's because you ordered the right amount or because you ordered too little and ran out early. Check how many days the product sat at zero stock before drawing a conclusion either way.
What is the difference between sell-through rate and sales velocity?
Sell-through rate is a percentage - how much of the stock you started with actually sold over a period. Sales velocity is a pace - how many units you're moving per day, regardless of how much you started with. A product can have strong sales velocity and still show a low sell-through rate if you're carrying a lot of stock, or a high sell-through rate with weak velocity if you simply didn't order much. The test in this article uses both together: sales velocity tells you how fast the product was moving before it hit zero, and sell-through rate tells you what fraction of the total buy that represents.
What is the difference between sell-through calculated on current stock versus a snapshot?
Current stock gives you a moving target - the same past period's sell-through rate keeps changing depending on when you check it. A snapshot pins the leftover inventory to one specific date, so the number for a closed period stays the same no matter when you look it up.
How many days of sales history should I use for the pre-stockout sales rate?
90 days is a reasonable default, but use whatever trailing window fits your sales cycle - a fast-moving product might need a shorter window, a seasonal one a longer one.
What counts as a good sell-through rate?
It depends on the category, and it's a general benchmark, not a substitute for checking your own days-at-zero. Apparel and fast fashion typically sit at 50-70% for the season, electronics and tech at 60-80%, food and other FMCG at 85% and above, and luxury goods at 40-50%. Under roughly 40% usually signals overstock; over roughly 80% usually signals stockouts.
Can I run this analysis if I just installed Mipler and do not have inventory history yet?
Not with full precision, but there's a workable shortcut: if a product's current inventory is zero, use the date of its last order as an approximate stockout date. It's less precise than a full inventory snapshot history, but it's enough to start spotting which products ran out early.