What are stockouts?
In the world of inventory management, stockouts (or out-of-stocks) are a business owner's worst nightmare. A stockout occurs when a product is unavailable for purchase due to depleted inventory levels.
Imagine this scenario: A customer embarks on a journey to find a specific product. After browsing the internet, they land on your website and find exactly what they need. They're ready to make a purchase, credit card in hand, only to discover at the final moment that the item is out of stock.
Negative Consequences of Stockouts
As a business owner, out-of-stocks are most likely one of the biggest concerns you have. They don't just stop sales, but can also lead to a number of negative consequences that affect your entire business. Here are some of the most detrimental effects of shortages:
- Customer Dissatisfaction: The customer leaves with a negative impression of your store.
- Lost Sales Opportunities: The customer turns to competitors, potentially never to return.
- Decreased Revenue: You miss out on potential sales and profits.
These outcomes are precisely what every retailer seeks to avoid. Let’s delve deeper into understanding the root causes of stockouts and explore strategies to prevent them.
What Causes Stockouts?
To effectively prevent stockouts, it’s crucial to understand their causes. Here are some of the most common reasons products go out of stock:
- Sudden Increase in Demand: Seasonal trends and major holidays can drive spikes in sales, as consumers are often purchasing gifts and essentials in higher volumes. Anticipating these fluctuations is key.
-
Delays in Supply Chain: Various factors can lead to supply chain disruptions, including:
- Adverse Weather and Force Majeure Events: Natural disasters and unforeseen events can disrupt logistics.
- Human Error: Mismanagement or oversight may result in delayed shipments.
- Manufacturer Issues: Strikes or operational challenges at the supplier level can halt production and distribution.
-
Inefficient Inventory Management: Effective inventory control is paramount, and challenges may arise from:
- Inaccurate Demand Forecasting: Predicting future demand inaccurately can result in either overstocking or understocking.
- Lack of Inventory Tracking Systems: Real-time visibility into inventory levels is essential.
- Delayed Product Transfers Between Locations: Timely movement of products between warehouses can prevent local stockouts.
- Failure to Account for Damaged Goods: Regular audits to assess product condition and wastage are necessary.
- Inadequate Storage Conditions: Poor storage can lead to product spoilage.
- Cash Flow Issues: Insufficient funds to replenish inventory can also cause stockouts.

Why Avoiding Stockouts is Crucial
Financial Losses
As mentioned earlier, stockouts directly impact revenue. Let’s look at how to quantify the cost of stockouts (Stockout Costs) using a straightforward formula.
To calculate Costs of Stockout (CoS), you need to use the next formula:
CoS = SD × ADS × PPU
Clarification:
- CoS — Costs of Stockout
- SD — Number of stockout days (when a product was out of stock)
- ADS — Average Daily Sales (units sold per day)
- PPU — Profit per unit
Example:
Suppose a product is unavailable for 4 days, with average daily sales of 8 units, and a profit of $12 per unit.
The stockout cost would be:
CoS = 4 × 8 × 12 = $384
It’s important to note that stockouts often occur across multiple items simultaneously, leading to potential cumulative losses that could be 10 to 100 times greater.
Customer Dissatisfaction
When customers can’t find what they’re looking for, they’re likely to turn to your competitors. While loyal customers may give your store another chance, most others may remember the negative experience and choose not to return.
Moreover, dissatisfied customers might leave negative reviews, affecting your store’s reputation. Such feedback not only leads to the loss of existing customers but also deters potential new customers, who may opt for a competitor based on poor reviews.
Increased Operational Costs
As a rule, everything that is urgent is more expensive. To quickly solve the problem of inventory shortages, companies can take the following measures:
- Sourcing Alternative Suppliers: New suppliers might not offer the same favorable terms as established partners.
- Expedited Shipping: Fast-tracked delivery options can be three to four times more expensive than regular shipping.
- Additional Labor Costs: Receiving inventory, conducting stock checks, and fulfilling delayed orders require overtime, which translates to additional operational expenses.

How to Prevent Stockouts
There are numerous effective strategies to help merchants avoid stockouts and maintain optimal inventory levels. Here are some of the most popular approaches:
- Purchase More Products: This method can significantly reduce the likelihood of stockouts but comes with a downside. Increased inventory means higher storage costs, as more space is needed to accommodate extra stock.
- Dynamic Inventory Management: This approach involves long-term collaboration with suppliers, where you gain a deep understanding of the supply chain and potential bottlenecks. By analyzing past delays, you can forecast demand more accurately and adjust reorder points during peak seasons, ensuring sufficient stock levels.
- Integration of Automated Solutions: Modern systems can centralize data, forecast demand, suggest reorder quantities, generate invoices, and even automate supplier communications. These solutions minimize time spent on demand planning and inventory management, ensuring a seamless supply chain process.
- Custom Demand Forecasting Systems: Every business is unique, and inventory management strategies should be flexible enough to adapt to individual business needs. A custom demand forecasting system allows you to tailor calculations based on specific variables, ensuring precise stock level maintenance.
Inventory management is a delicate balance between continuous stockouts and overstock. You need to decide which situation is more preferable for you: being out of stock or having excess stock.
In this post, we'll dive deeper into how we developed our demand forecasting system and how it can be used effectively.
How to find Stockout Report in Shopify
Shopify doesn't offer a complete stockout report by default. However, by exporting Shopify reports to Google Sheets and combining the numbers, you can create a custom report that provides a comprehensive view of your inventory status. In this section, we’ll show you how to combine data from Shopify and Google Sheets to manage your stockouts effectively.
Here's what a complete stockout report should include:
- Average Daily Sales: Current sales trends and forecasts.
- Days of Inventory Remaining: How many days until stock depletion.
- Demand Calculation for the Next X Days: Anticipated future demand.
- Safety Stock Levels: Optimal inventory quantities to prevent stockouts.
How To Build Stockout Report Using Google Sheets?
At Mipler, we’ve created a Google Sheets template that assists merchants in accurately forecasting demand and addressing key questions like:
- When to reorder products
- Optimal reorder quantities
- Minimum safety stock levels
To use our template with inventory forecast, follow these simple steps:
- Access the Shopify Stockout template via this link.
-
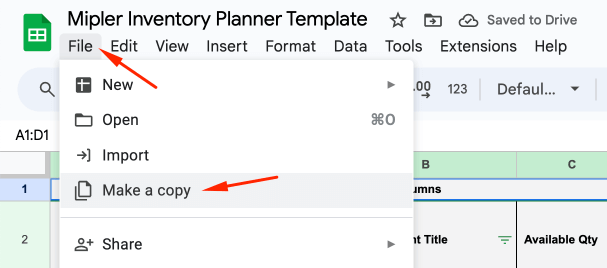
Make a copy of the template for your use:
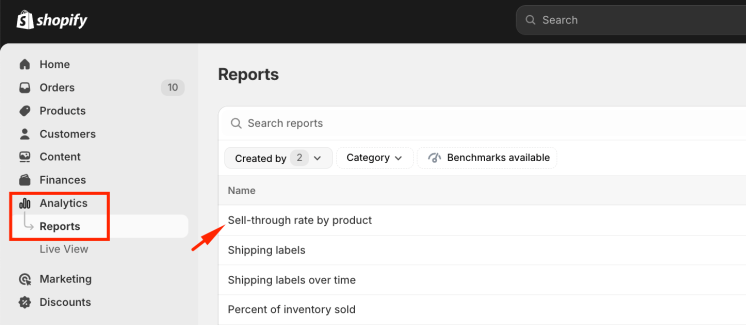
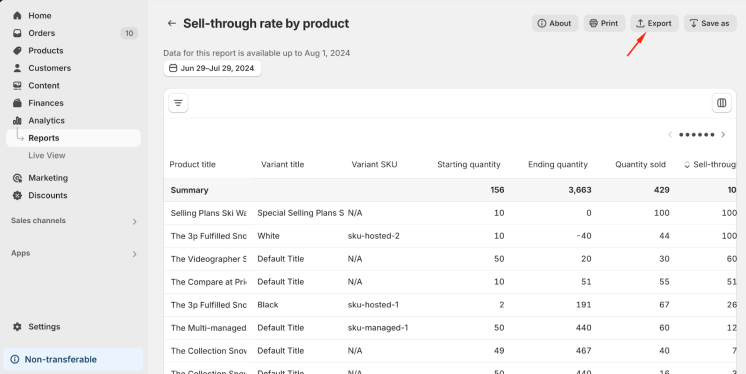
- In your Shopify admin panel, navigate to Analytics > Reports.
-
Open the Sell-through Rate by Product report:
-
Export the report data:
-
Paste the exported data into the third tab of the template,
titled "3. Paste Sell-through rate by product Report":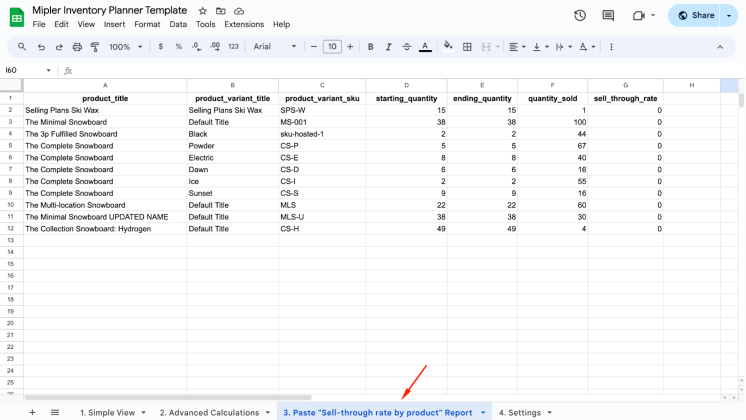
- Once you insert the report, our template will automatically calculate all the metrics, which you can find on the Simple View and Advanced Calculations tabs.
Formulas and Definitions used in the Template
All formulas used in the template are described in the Shopify Inventory Planner Forecasting Reports post. Many columns include notes, which can be viewed by hovering over the column name marked with a colored triangle in the upper-right corner.
Tab 1: Simple View
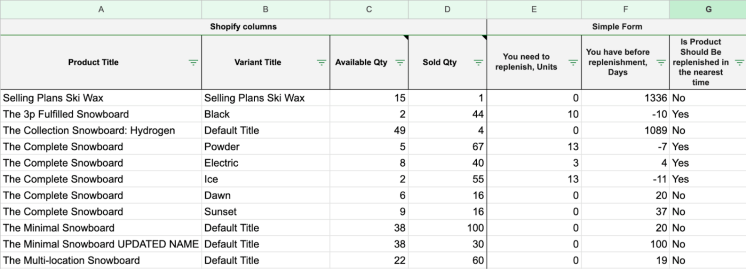
The “Simple View” tab provides basic calculations, answering questions like:
- How many products need reordering? (Column E)
- How many days until reorder is necessary? (Column F)
- Should the product be reordered soon? (Column G)
Tab 2: Advanced Calculations

The second tab offers more detailed insights into calculations, allowing merchants to understand and modify any values as needed. This flexibility enables customization to fit specific business requirements.
Tab 3: Paste "Sell-through Rate by Product" Report

Data from the “Sell-through Rate by Product” report should be pasted here without any modifications. This information serves as the foundation for the reports generated on Tab 1 and Tab 2.
Tab 4: Settings
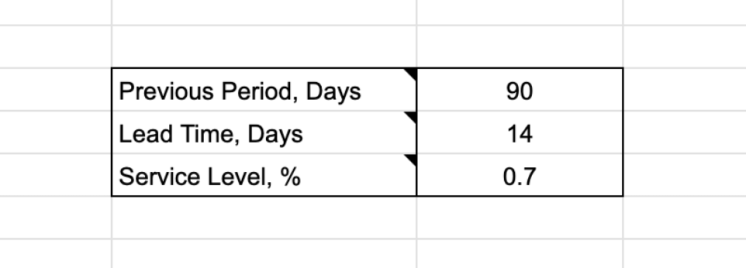
Variables can be changed in this tab. We recommend entering your parameters immediately, including:
- Previous Period, Days: Specify the period used for generating the report on Tab 3.
- Lead Time, Days: Average time for products to be delivered from suppliers.
- Service Level: Expected probability that inventory won’t run out during the next replenishment cycle (also known as the probability of not losing sales). Generally, service levels range between 70-90%.
Pros, Cons, and Possible Improvements of this Template
Pros:
- No need to install additional applications.
- Transparent calculations, allowing merchants to tweak formulas as desired.
- Relative flexibility with custom variables in the Settings tab.
Cons:
- Inability to generate location-specific reports.
- Uniform parameters for all suppliers.
- Manual updates required for refreshed data.
Improvements:
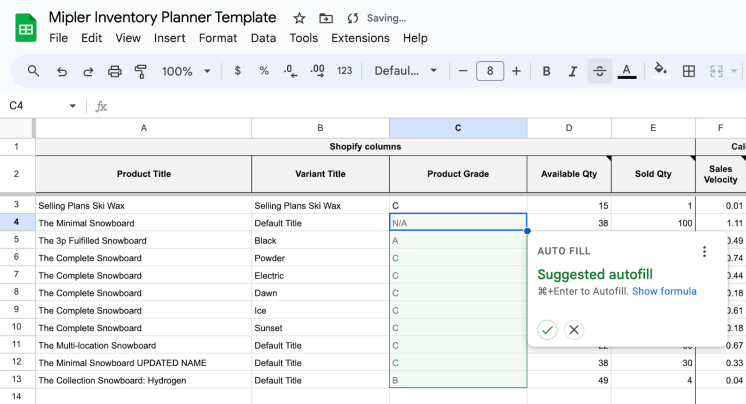
This report can be easily expanded by adding data from other reports to the calculations tab. For example, we need to add the Product Grade column from the ABC Analysis report to the Advanced Calculations tab. Let's see how to do this:
-
First, we need to create a new tab in our template.
To do this, click on the “+” sign in the lower-left corner: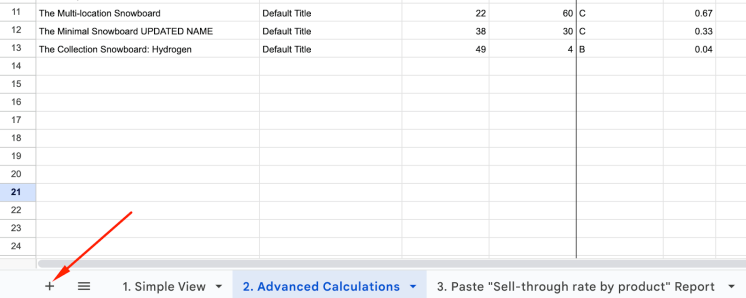
-
Next, you need to navigate to the new tab and insert the “ABC Analysis by Product” report from the Shopify admin panel,
located in the Analytics > Reports menu:
-
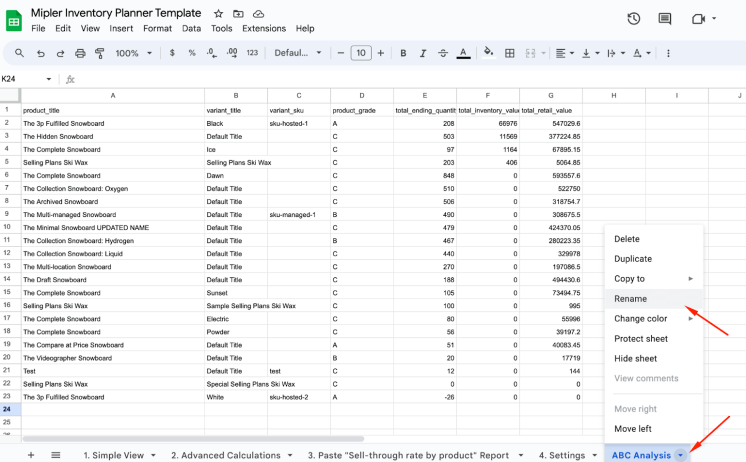
For convenience, it is recommended to rename the tab, for example, to ABC Analysis:
- Let's go to the “2. Advanced Calculations” tab.
-
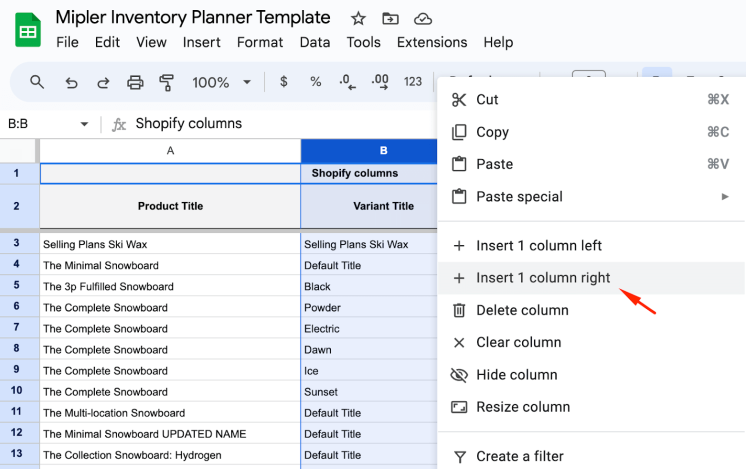
Insert a new column, for example, immediately after the Variant Title:
-
In the new column, in the third row, insert a formula that will pull the Product Grade value from the ABC Analysis tab if the product name and variant match on both tabs. The formula is:
=IFERROR(
    INDEX('ABC Analysis'!D:D,
    MATCH(1,
    ('ABC Analysis'!A:A = A3) * ('ABC Analysis'!B:B = B3), 0)),
"N/A")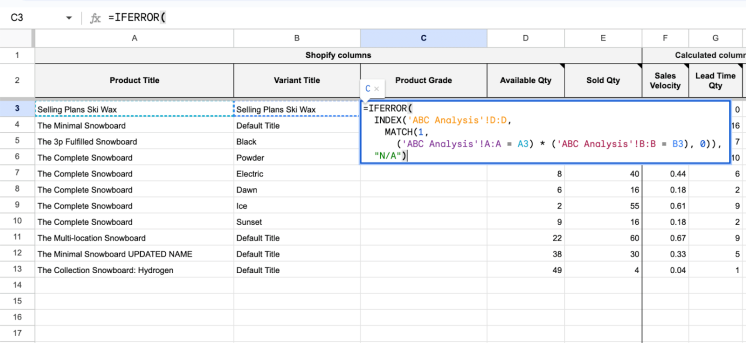
Next, use the auto-complete feature to apply the same formula to the other rows; the values will be filled in automatically:
Solution:
Using the Mipler App, you can set different values for variables for each supplier and location, such as delivery times, minimum safety stock levels, etc. These data will be automatically inserted into the formulas.
Conclusion
In this post, we've explored the concept of stockouts, their prevention, and potential repercussions. We've provided actionable advice to minimize the risk of unexpected stock depletion.
Additionally, our customizable solution is designed to adapt to your unique needs. Our support team is eager to assist you in creating Shopify Custom Reports and columns tailored to your business requirements.
Ensure your store is always stocked, your customers satisfied, and your profits maximized with Mipler's expert solutions.
