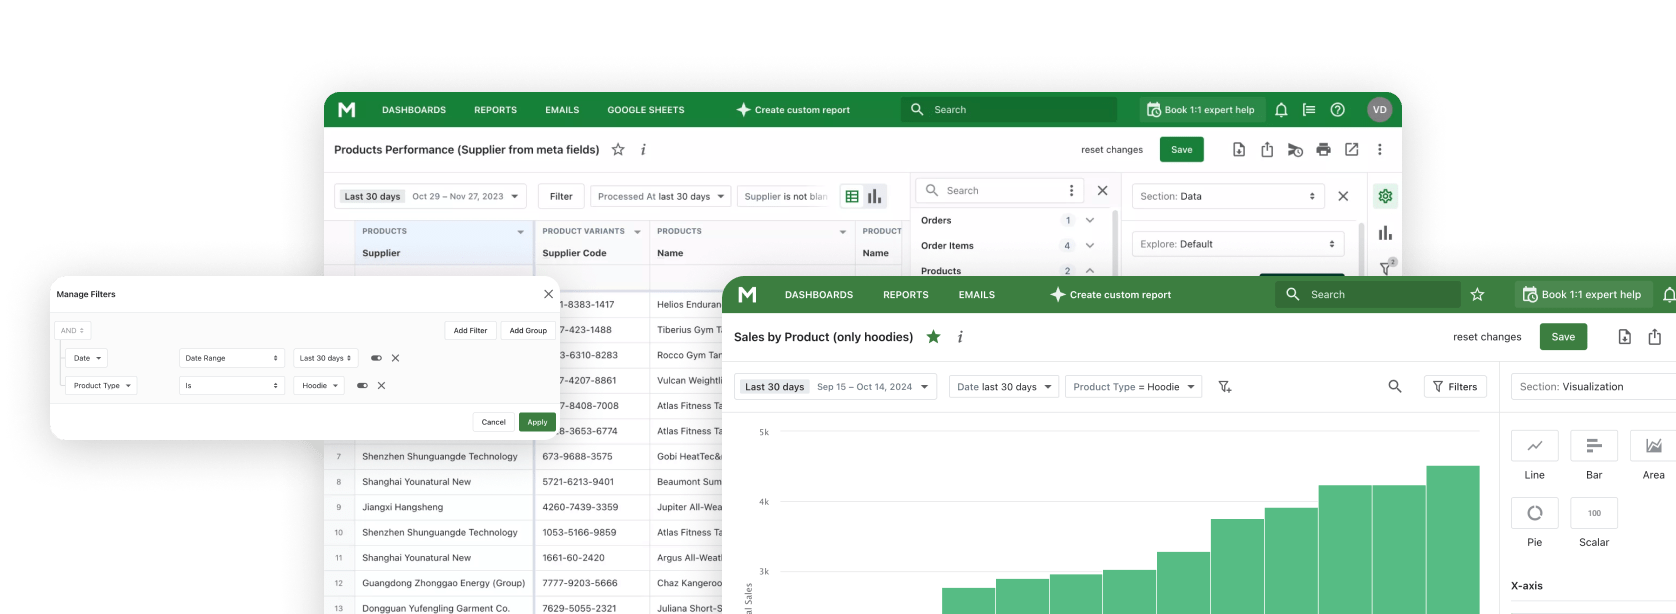
With comprehensive reporting capabilities, you can gain valuable insights and make informed decisions based on real-time data.
Build custom reports that fulfill business requirements and visualize results.
Exporting
Export reports to various formats: XLSX, CSV, PDF, HTML, JSON.
Quick access & Sharing
Share reports with others using direct links or use the link for quick access.
Drill Down
Easily drill down from aggregated data view to detailed data within one click.
Integration with Google Sheets
Insert live report data from the app into Google Sheets without exporting each time.
Complex charts
Use various charts to visualize data: Bar, Column, Scatter, Linear, etc.
Pivot Tables
Organize data for easy reading: swap rows and columns, pivot by a few columns.
PIP Comparison
Compare actual data with past data by period or complex filters.
Nested Filters
Fulfill business requirements with nested filters and logical conditions: AND, OR.
Overview of all key information in one place.
Cross and Global Filters
Filter metrics on the dashboard using a global filter or drill down with cross filters.
TV Mode
Display only metrics, tables, and charts in Screenful dashboard mode.
Simple access to data in any way that you need.
Shareable Links
Share reports with your team using direct short links.
Scheduled Emails
Setup schedule for email notifications with required reports by preset period.
Push to Google Sheets
Insert report data directly to Google Sheets with auto-update every few minutes.
The data modeling layer describes what data is stored in the database, how tables are related, and declares ready-to-use formulas or calculations.
ACE Syntax
Easy-to-use Advanced Calculation Engine syntax allows you to define all required things: explores, views, measures, dimensions, joins, and derived tables.
Derived tables
Transform and put data into derived tables to feature using in the SQL queries.
Business metrics and calculations
Define, validate, and test the business required metrics and formulas.