Introduction
Any store needs constant monitoring. It doesn't matter if you are new to this business, or you already have several stores. It is clear that you need to keep your finger on the pulse, even on weekends. As strange as it may sound, the growth of profit and the number of customers does not always indicate the success of the store. Online stores have their own characteristics in management, without knowing which you can fall into the trap of illusions.
Don't panic! If you know what indicators to monitor, you won't need to check all the reports in search of problems. We will provide you with a list of Shopify most important metrics that can show a complete picture of the store's operation. For some Shopify Reports will be enough, for some it will be worth calculating using Google Sheets.
Sales Conversion Rate
A metric that shows what percent of your website visitors made a purchase. We would call it a key Shopify metric. Conversion rate is a very accurate and clear indicator of the effectiveness of your business.
Formula:
Sales Conversion Rate = (Number of purchases / Number of visitors) * 100%
Normal result for Shopify store: 1-3%
Shopify Sales Conversion Rate shows on the home page of your Shopify admin.
First, buyers evaluate your site and the convenience of working with it. If Sales conversion rate is less than one percent, first pay attention to:
- Your product pages - is the description and convenient images clear enough;
- The ordering process - make it as convenient as possible.
If you are still not satisfied with the result, you may:
- Offer free shipping or discounts;
- Conduct A/B testing;
- Remind visitors who abandoned the cart.
Average Order Value (AOV)
Knowing the results of calculating this Shopify order metric, you can immediately see how much buyers are willing to spend on purchasing goods in your store.
Formula:
AOV = Total Sales / Number of orders
All necessary information is in Shopify Sales Reports. You immediately see both the number of orders and Total Sales. There is no single normalized value. Only you choose whether you are satisfied with the results or not.
If you are not satisfied, then the situation can be corrected by offering buyers additional products, for example:
- Set the purchase amount, after which there will be free shipping;
- Provide a discount for a pair of products;
- Create related products.
If the results are satisfactory, then you should still monitor the number of orders. If you sell premium products, AOV may completely suit you, but the products will be sold in small quantities due to their high cost.
Bounce Rate
Bounce Rate shows the percentage of visitors to your site who left after viewing the first page. They didn"t buy anything, didn't add to cart, just viewed the first page they landed on.
Information about Bounce Rate can be obtained from Google Analytics, or another application for monitoring site activity. A high Bounce Rate may indicate technical problems with the site, or an insufficiently interesting presentation of your products.
You don't know which page the visitor will first land on. Maybe your views on design just didn't match. However, the product description, their photos, and the intuitive design of the site should be at their best.
At a subconscious level, a person needs 3 seconds to form an opinion about the picture in front of their eyes. Your best assistants are associations. Use standard images and colors to make it convenient for users to navigate the site. For example:
- ? - user support;
- message cloud - chat;
- x - exit.
Explore related reports
Click-through Rate
Click-through rate is the result of your targeting team's work and an indicator of the quality of your ads. It shows how many readers clicked on an ad, email, or banner.
Formula:
CTR = (Number of Clicks / Number of Impressions) * 100%
Google Analytics automatically calculate this Shopify metric. As with all marketing metrics, the CTR rate is 1-3%. If it's less than one percent, you should review the quality of your ads.
For email marketing, you should calculate CTR. The goal of emails is to bring back existing customers. You shouldn't add to the results of your Instagram or TikTok campaigns.
In general, to improve results you should:
- Improve the quality of your ads;
- Review your approach to writing headlines and CTA buttons;
- Conduct A/B testing of your advertising campaigns.

Shopping Cart Abandonment Rate
This indicator will help you find out how many buyers did not complete the purchase process. This can happen for various reasons: a change in mood, a certain product is not available, a convenient delivery method is not available.
Your task is to ensure that this is not due to the inconvenience of your site. If the result is lower than you expected, first of all, check whether the ordering process is easy enough. It is also worth paying attention to whether you have popular payment methods and how much it costs to deliver an order to the most remote regions.
Formula:
Abandonment Rate = (Number of Abandoned Carts / Number of Created Carts) * 100%
It's not always up to you to decide whether a customer abandoned their cart. But you can encourage them to complete their purchase. To do this, you may:
- Simplify the checkout process;
- Offer free shipping;
- Remind the customer of the abandoned cart via email or advertising.
Return on Investment (ROI)
ROI is a financial indicator that reflects how successfully you can use the money invested in your business. It is usually calculated overall for the entire store and separately for marketing.Formula:
ROI = (Revenue - Cost) / Cost * 100%
It is easy to calculate using reports, they store information about the profit received for a specific period, and you know the amount invested.
An unsatisfactory result may indicate that the budget was distributed incorrectly. It may also be that you did not take into account all the factors that affect the result.
To improve ROI, you should:
- Assess the effectiveness of advertising campaigns;
- Stop purchasing products that sell poorly or always remain in stock as dead inventory;
- You can try to increase the cost of products, but only if you are sure that this will not reduce demand for them;
- Improve the impression of the shopping experience so that buyers return.

Inventory Turnover Rate
If you doubt the effectiveness of your sales, pay attention to this indicator. It shows not only the state of inventory, but also how actively the goods are being sold.
Formula:
Inventory Turnover = Cost of Goods Sold (COGS) / Average Inventory
IMPORTANT: For different areas, the normal value of inventory turnover is different. If you sell clothes, then you cannot compare the results of the indicator with a hardware or cosmetics store. You should ask other business owners in your market segment how many days it takes them to sell inventory. Then calculate Inventory Turnover for your store using the Shopify Inventory Reports. The average value will be the norm.
It may happen that sales show little progress, but Inventory Turnover is within the normal range for your store. This means that you are investing wisely in your inventory. You are not buying exactly as much as you can sell.
To reduce the indicator, you should:
- Analyze demand using RFM analysis;
- Consider goods from the point of view of XYZ analysis;
- Adjust inventory purchases according to the results of the analysis;
- Increase marketing activities and cross-selling.
Customer Acquisition Costs
And this Shopify metric is the result of the store's marketing activities. It clearly shows how much it cost to attract each new customer.
Formula:
CAC = Total Marketing and Sales Expenses / Number of New Customers
If you enter all the necessary data into Google Analytics, CAC can be calculated automatically. The reason for negative results may be poor-quality advertising, untargeted message distribution channels, incorrect definition of the target audience. In addition, the result will affect ROI. Therefore, it is very important to change your tactics at the first signs of negative results.
If you think this indicator is too high, try:
- Use organic customer acquisition channels (SEO);
- Increase the number of email newsletters;
- Retain customers through loyalty programs.
Returning Customer Rate
As the name suggests, you will find out what percentage of users return to your store for repeat purchases.
Formula:
Returning Customer Rate = (Number of Repeat Customers / Total Number of Customers) * 100%
If you conduct email campaigns, then by comparing the CAC for emails and the results of this indicator, you will get the effectiveness of your actions. If you do not stimulate repeat demand with emails, then the returning customer rate will help you understand how much your products interest buyers.
Average Session Duration
Shows how long on average buyers spend on your site.
Formula:
Average Session Duration = Total Duration of All Sessions / Number of Sessions
You can calculate this indicator using Google Analytics. There is no standard value for this metric. However, it is desirable that it be at least two minutes.
To increase the time a customer spends on your site, it is important to interest them. Link similar or complementary products to each product. If a person buys shower gel, offer shampoo, a washcloth, and a towel. It doesn't have to be the same price; it's better if the products offered are less expensive. However, it is important that it is necessary.
Traffic Sources
It is clear that your store's website was found not only through direct search. Traffic Sources is not a
classic indicator. It is rather a list of links to sites where buyers saw your products or store. You can
find this list in the following way:
Shopify admin > Marketing > Top marketing channels – View
channel report.
However, you will get more accurate data if you track store activity through Google Analytics.
Shopify and Google Analytics may show different metrics. This happens because GA also evaluates organic
traffic to your website.
You need to strengthen your marketing activities on the sources from which your customers come. If it is a direct search on the Internet, then improve SEO. If it"s Instagram, then you should pay for an advertising campaign and think about collaborating with bloggers. It is equally important to encourage your previous customers to return. In this case, you need to increase the quality of email newsletters. This is the best source for re-increasing customer demand.
Sales Overview
How to track your Shopify sales metrics? It is clear that these are very important values. But will it be enough to monitor the growth of product sales? You can always assess on which days or months your products are bought more actively. Also, sales results will show which supplier's quality is more popular with buyers. The growth or decline in sales by a certain factor reflects the preferences of buyers.
Sales Overview will show a general picture of your buyers" activity. This is the first step, the first threshold value that store sellers pay attention to if something is going wrong. It is the general sales overview that will show whether your profit is growing, whether many parcels are being returned.
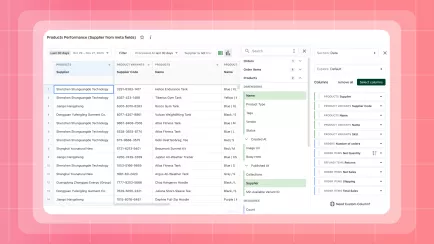
The most convenient way to do this is with the help of reports and dashboards. Visualization will help you assess the current situation in seconds - the graph will show whether sales are growing or falling. And reports will show each indicator related to a specific sales day in more detail. All the information is in one place. You can immediately compare how much more goods were sold today than yesterday. Mipler calculated all key indicators in detail: number of orders, gross sales, discount, returns, taxes, total sales.
Sales by Product
The first thing you can assess with the help of sales information is the popularity of products. It is enough to look at Net Quantity or Net Sales and it becomes clear which of them are more popular with customers. It may be that you are not satisfied with the results. Then it is worth reviewing the quality of the product, the cost of its delivery. You can also offer discounts on these positions in your catalog, or tie unpopular products to popular ones.
The results of product sales in Mipler can be viewed in the corresponding Sales by Product report. You can sort the data obtained by decreasing Net Sales and you will see your most popular products at the top.
Sales by Vendor
This indicator will help you assess how best to allocate space in the warehouse. The quality and characteristics of the goods of each manufacturer are different. It is sales that will help you assess which of them your customers like more. Then it will be easier for you to decide how much space to allocate for the goods of a particular manufacturer.
By choosing quality goods, you can improve your reputation in the market. People will come back to you again and again. This will affect the turnover of your stocks and the return on investment. The faster you can return the money invested in the products, the more profitable you look to investors.
To make all the information quickly accessible, Mipler created the Sales by Vendor report. You won't need to analyze all your inventory. It will be enough to open the report.
Sales by Discount Code
Now let's move on to purely marketing metrics. Discount Codes will show you which emails resonated with your customers" visions and prompted them to make a repeat purchase. If you work closely with bloggers or pay for advertising campaigns on Facebook, Instagram, and TikTok, you will see which method or person interested viewers more.
From the information received, two main conclusions can be drawn:
- Our customers like this format;
- This format needs to be worked on.
All information about the results of marketing actions is structured in the form of a Sales by Discount Code report from Mipler.
Sales by Day of Week
It may seem like a strange indicator, but it is also part of your success. Knowing how effective your sales are on a certain day of the week will help you draw several conclusions:
- You get a list of days when the greatest profit is generated;
- You know the days when you should intensify marketing activities so that they also bring buyers;
- You know which days your website should not be broken, and when you can reconfigure it.
In the Sales by Day of Week report from Mipler, you can see your strengths and weaknesses. It is worth paying attention to the fact that sales by day of the week show more about your customers" preferences than the efficiency of the store. If you are not satisfied with the indicators, try offering customers promotions that will force them to buy goods on the day you need.
Sales by Collection
And back to products. Only now we assess the popularity of entire groups of your products. It is especially important to know this when you add seasonal products or special items to the catalog.
You form collections yourself in the administrative part of the store. But they are also visible to your customers. With the help of Sales by Collection report, you can assess which of your products best meet the needs of your customers. Focus on these products: increase quality, reduce shipping costs, offer interesting discounts. Then your products will always be competitive in the market.
If you are not satisfied with the results, pay attention to the names of the collections. If you have given a non-standard name to the group or placed products there that are not associated with the name, this will be reflected in sales. Customers will not be able to find the necessary products by name.

Fulfillment Overview
Fulfillment Overview will help you to assess the entire process of sending goods in general. Since this is a general indicator, the result will be influenced by the state of its components:
- Warehousing - incoming products, suppliers, placing products in the warehouse, caring for goods;
- Inventory management - organizing the placement of goods, packing ordered goods, ordering the required quantity from suppliers, avoiding shortages and surpluses of goods;
- Order processing - packing the order, selecting boxes, choosing the specific goods that will be sent to the buyer, changing the order status;
- Logistics (Shipping) - choosing a delivery route, choosing a carrier, tracking the location of the goods in real time;
- Returns management - organizing the delivery of returned orders, communicating with the customer about the problem, resolving complaints.
The overall status of the process can be monitored using the Shopify Fulfillment over time Report. For a more detailed review, you should refer to the Mipler reports: Fulfilled Orders, Unfulfilled Orders, Shipping Report.
Tax Details
Of course, we can't ignore taxes. You determine what taxes you pay and configure them in Shopify Admin. However, to keep everything under control, you should periodically check tax details.
With Shopify tax reports by Mipler, you can see not only sales tax. Control the taxes you pay in all countries where you sell, including in different states. In addition, you can see what taxes were paid on the sale of each type of your product.
How to Optimize Your Shopify Store Performance with Metrics
With the help of the described indicators, you will be able to control all areas of your store's operation:
- Track sales and profitability;
- Analyze customer behavior, understand their preferences and adapt to demand;
- Evaluate marketing effectiveness;
- Qualitatively manage the entire process of sending orders;
- Monitor inventory;
- Increase the efficiency of operational processes.
Using analytical tools such as Mipler will simplify the calculation of many indicators. All information will be stored in a single source in a structured form. You will be able to get metrics from Shopify, spend less time on data analysis, and use ready-made calculations.