What is eCommerce product analysis?
eCommerce product analysis is an analysis performed on data, that is directly related to your store products. The various sets of data collected for the same products allow you to get a clear and precise picture of the actual state and determine trends.
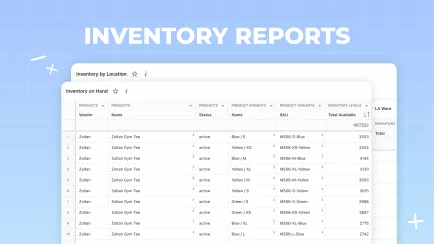
Shopify Reports are an essential tool for product analysis, offering detailed insights into sales performance, inventory levels, and customer preferences, which help in making data-driven decisions to optimize your store's offerings.
Why and when do you need product analysis?
The key tasks of product analysis are:
- Get an actual picture of the current state
- Determine trends
- And most important - split products into two categories "good" and "bad" products
Determining what products are good, allows concentrating efforts on the right products and forgetting about bad products.
There are a few conditions to classify a product as good:
- Product with good current metrics
- Product with predicted good metrics, in other words, high potential product
Key kinds of analysis
In the common cases, analysis types can be split by kind of data:
- Based on sales data
- Based on customer behavior data
- Based on SEO data
Or by scope:
- Overall store
- By a set of products (i.e. by collection/category, vendor, product type, etc)
- Particular products
In different cases, different scopes are applicable. But still, the analysis starts from the top-level (store, category) to the bottom (particular product or even product variant) and you need constantly compare the top (average for a set of products) metric value with the low (product level) metric value.
Engagement Analysis
Engagement analysis is mostly performed on web analytics data, like Google Analytics. And it includes drilling through the eCommerce sales funnel.
- Impressions
- Views
- Add to cart events
- Checkouts
- Transactions
And then the derivation of derived metrics:
- Impression-to-view rate
- View-to-cart rate
- Cart-to-checkout rate
- Abandonment cart rate
- Checkout-to-transaction rate
For example, a low view-to-cart rate for particular products compared to other products may alert different problems, like bad product description or illustrations, not competitive price, or even non-competitive products compared to similar products.
A low impression-to-view rate, alert non-competitive products, worse illustrations, or bad short description.
Explore related reports
SEO Analysis
Search engine optimization analysis and SEO itself is a huge scope of modern e-commerce life.
There are thousands of articles that describe all SEO aspects and hundreds of different tools.
From common free tools that are available, look at Google Search Console, which provides priceless information about the actual state: impressions, clicks, search terms, and average positions. Also you can check fully-featured tool that provide best in class SEO Monitoring and Testing functionality for Shopify stores.

Even an overview investigation of that data, allows you to determine traffic potential for product/category, hot search terms, and underperformed terms (by click rate).
As result, you can slightly adjust product SEO: title, description, heading, etc, and get tons of benefits.
ABC Analysis
| ProductsName | Product VariantsName | Product VariantsSKU | Product Variant AbcGrade | Inventory LevelsTotal Available | OrdersTotal Sales |
|---|---|---|---|---|---|
| Abominable Hoodie | Blue / XS | MH09-XS-Blue | A | 200 | $4,066.32 |
| Abominable Hoodie | Red / XS | MH09-XS-Red | A | 54 | $3,925.87 |
| Adrienne Trek Jacket | Gray / XS | WJ08-XS-Gray | A | 65 | $2,205.73 |
| Adrienne Trek Jacket | Orange / XL | WJ08-XL-Orange | B | 23 | $1,969.64 |
| Abominable Hoodie | Blue / S | MH09-S-Blue | C | 671 | $1,961.57 |
| Abominable Hoodie | Green / XS | MH09-XS-Green | C | 460 | $2,816.08 |
| Adrienne Trek Jacket | Orange / XS | WJ08-XS-Orange | C | 72 | $1,336.50 |
| Adrienne Trek Jacket | Purple / S | WJ08-S-Purple | C | 87 | $3,769.86 |
| Aero Daily Fitness Tee | Black / XS | MS01-XS-Black | C | 12 | $1,351.80 |
| Aero Daily Fitness Tee | Brown / XS | MS01-XS-Brown | C | 231 | $974.90 |
ABC Analysis is an unbelievably powerful approach to determining "right" products and detecting "bad" products.
In a few words, we split all products into three categories: A, B, and C.
Products from group A generate 70% of revenue, group B - another 20%, and group C - all others.
For different stores, the number can vary, but typically:
- Class A (70% of revenue) includes only 10%-20% of products
- Class B (20% of revenue) - 30% of products
- Class C - 50%.
In other words: 10%-20% - super "right" products, 30% - near to be "right", 50% - to forget.
FSN analysis: Slow-moving, fast-moving, and dead products
FSN analysis is based on inventory moving and is commonly mostly useful for inventory planning. It the principally similar to ABC, except it is based on quantity and segregating products into Fast-moving, slow-moving and non-moving groups.
For example, the fast-moving group includes the stock that moves too quickly compared to other products and as result requires more attention (replenish ratio is high).
Order or cart level analysis
This kind of analysis includes various things that customers made: sequence of purchased products, returns, commonly purchased sets of products, etc
Products bought together
Customers often purchase few products together and selling more increases average order value (AOV)
Determining what products are often purchased together (in one order or in a few orders by the same customers) allows for improving products recommendations (Cross-sell, Related, and Upsell products)
| Bought TogetherProduct A | Bought TogetherProduct B | OrdersNumber of orders |
|---|---|---|
| Josie Yoga Jacket | Primo Endurance Tank | 14 |
| Antonia Racer Tank | Sparta Gym Tank | 12 |
| Tiffany Fitness Tee | Zoltan Gym Tee | 12 |
| Augusta Pullover Jacket | Proteus Fitness Jackshirt | 11 |
| Autumn Pullie | Atomic Endurance Running Tee (Crew-Neck) | 11 |
| Balboa Persistence Tee | Mars HeatTech™ Pullover | 11 |
| Olivia 1/4 Zip Light Jacket | Mona Pullover Hoodlie | 11 |
| Desiree Fitness Tee | Tristan Endurance Tank | 11 |
| Rocco Gym Tank | Gobi HeatTec® Tee | 11 |
| Maya Tunic | Juno Jacket | 11 |
| Typhon Performance Fleece-lined Jacket | Chaz Kangeroo Hoodie | 11 |
| Bella Tank | Minerva LumaTech™ V-Tee | 11 |
| Argus All-Weather Tank | Ryker LumaTech™ Tee (V-neck) | 11 |
| Josie Yoga Jacket | Miko Pullover Hoodie | 10 |
| Layla Tee | Balboa Persistence Tee | 10 |
| Layla Tee | Beaumont Summit Kit | 10 |
| Layla Tee | Eos V-Neck Hoodie | 10 |
| Layla Tee | Stellar Solar Jacket | 10 |
| Lucia Cross-Fit Bra | Radiant Tee | 10 |
| Lucia Cross-Fit Bra | Selene Yoga Hoodie | 10 |
| Maya Tunic | Selene Yoga Hoodie | 10 |
| Minerva LumaTech™ V-Tee | Chaz Kangeroo Hoodie | 10 |
| Minerva LumaTech™ V-Tee | Taurus Elements Shell | 10 |
| Minerva LumaTech™ V-Tee | Zoltan Gym Tee | 10 |
| Olivia 1/4 Zip Light Jacket | Abominable Hoodie | 10 |
| Olivia 1/4 Zip Light Jacket | Balboa Persistence Tee | 10 |
| Proteus Fitness Jackshirt | Abominable Hoodie | 10 |
| Selene Yoga Hoodie | Helios Endurance Tank | 10 |
| Olivia 1/4 Zip Light Jacket | Zoltan Gym Tee | 10 |
| Ariel Roll Sleeve Sweatshirt | Helios EverCool™ Tee | 10 |
| Atomic Endurance Running Tee (Crew-Neck) | Orion Two-Tone Fitted Jacket | 10 |
| ... | ... | ... |
Products return rate
Comparing return rates for different products or sets of products, can insight into problems with description, delivery, quality, and so on.
Inventory Planning & Forecast
Inventory planning is another huge scope of analysis and forecasting. More detailed you can read about it here: Shopify Inventory Planner Reports