What information Sales by product report shows
Sales by Product report (also called Product Performance) is a common report used by store managers and salesmen for sales analysis. This report provides a view of specific products' sales.
The report is presented by a date range that is selected manually. Typically, it is formed as a table with each row corresponding to one product. The columns of the report are used to display various sales statistics on this product.
Depending on the reporting app the store uses, it can be possible to transform the report output form from a data table to a graphic chart.
What questions the Sales by product report can answer
Sales report by product allows tracking all information generated by product sales. It can be used to answer such questions:
- get total sales amounts of all products in a store for any time period
- see how well a specific product sells
- get the best and worst-selling products in your store
- compare specific product sales with the previous time period
- for each product, get the number of ordered and refunded items
- for each product, track coupons and discounts
The list of answers you may get with the Sales by product report can be extended by using additional data columns and data filters.
Similar reports to Sales by product report
Sales statistics in a store are not limited exclusively to data on product sales. A Shopify store owner may use several other sales reports alongside the product sales report.
Often in conjunction with the product sales report, store managers use such reports as sales:
- by product vendor
- by product variant
- by discount
- by traffic referrer
- by billing location
- by checkout currency
- by channel
- by customer name
Additionally, a store manager may build the sales reports by product tag, by POS location, and a dozen of other similar reports on sales. The exact list of available reports depends on the utilized reporting app.
Key columns of Sales by product report
The default configuration of the Sales by product report in the Advanced Reports app includes eight columns:
- product name
- number of orders
- total quantity of orders
- total quantity of refunded items
- total amount of refunded items
- ordered items total net amount
- total discount allocation
- ordered items total price
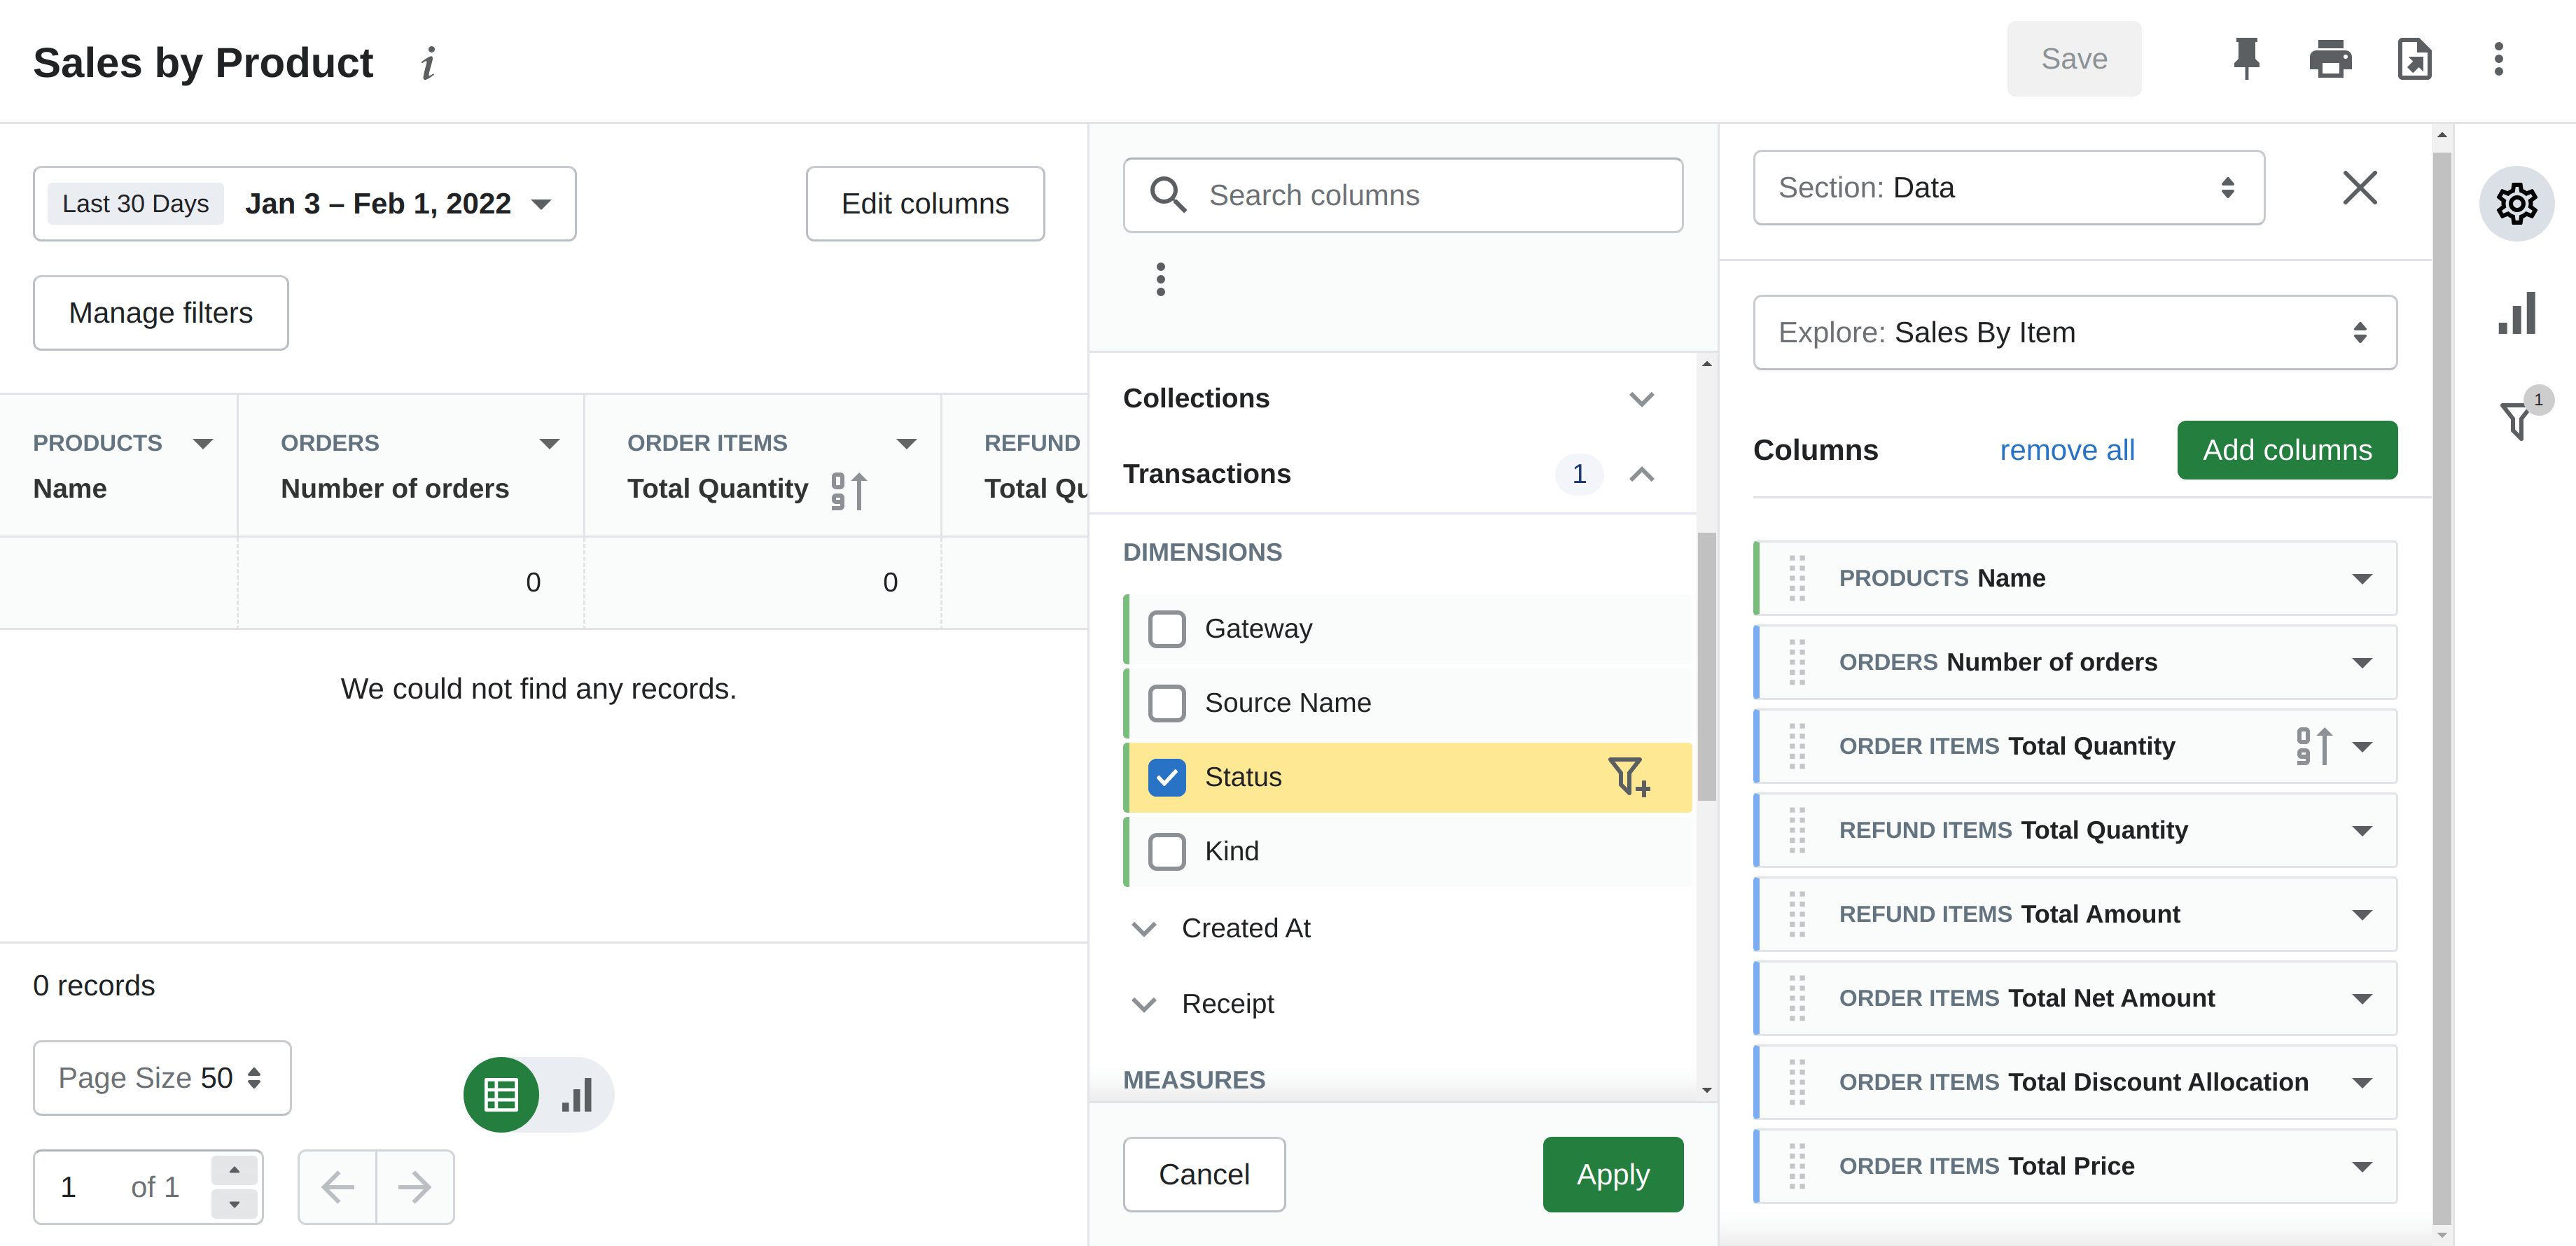
You are totally free to exclude any of the existing columns from the report or add several additional ones. Simply choose available columns from the list.
Sales by product report in Advanced Reports app
First launch of Advanced Reports app
When launching the Advanced Reports app for the first time in your store, you will be greeted with a questionnaire to provide some additional information for its developers to enhance the app in the future.
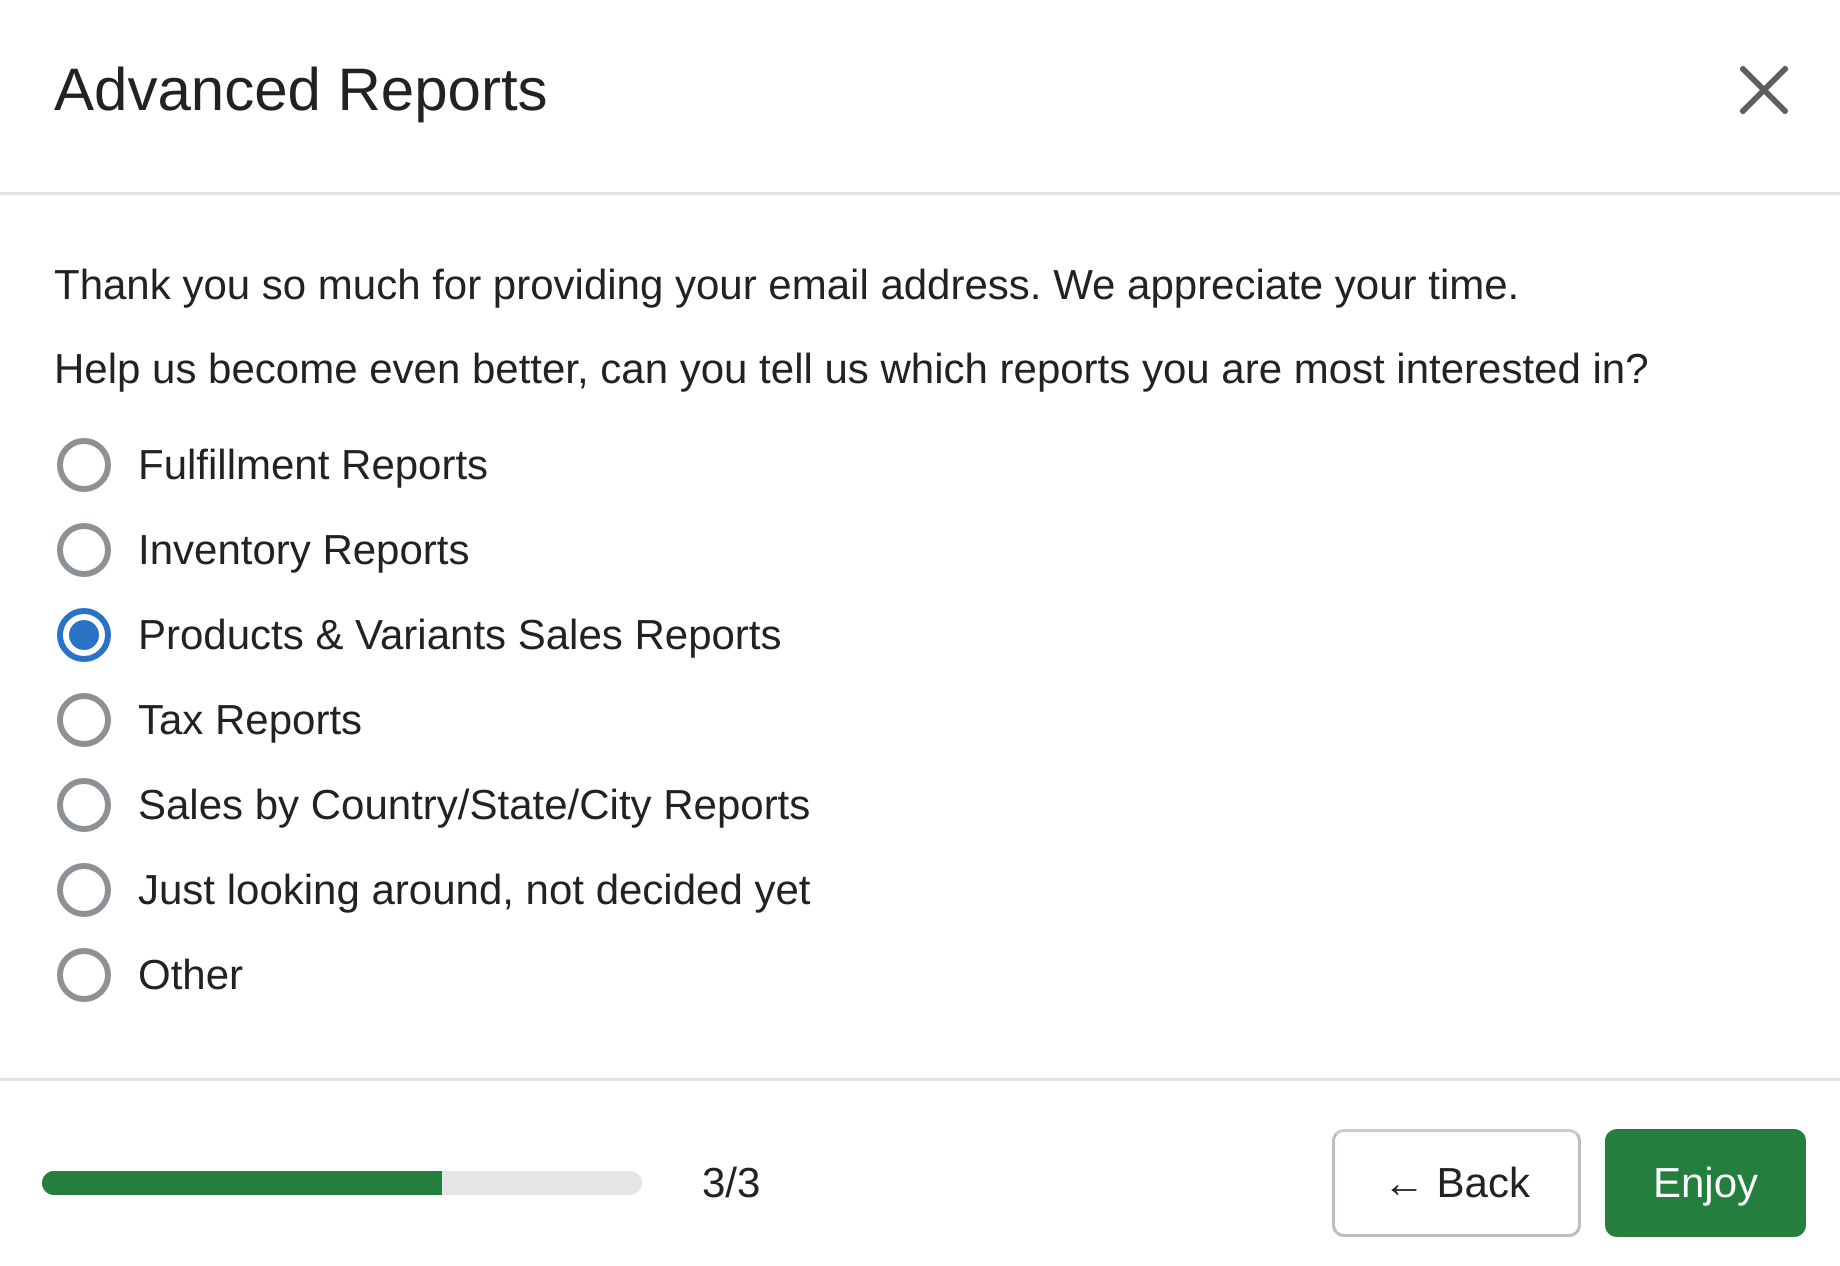
This step will not take a long time, and you need to provide answers only to two questions. These questions are: contact email and the major planned usage of the app.
When using this app, you will be also presented with a questionnaire "How would you rate the app experience, What feature is most important for you, What features do you want to see next" to additionally help developers to improve the app.
Default columns in Sales by product report
The default configuration of the Sales by product report in the Advanced Reports app includes eight columns: product name, number of orders, total quantity of orders, total quantity of refunded items, total amount of refunded items, ordered items total net amount, total discount allocation, ordered items total price.
You are totally free to exclude any of the existing columns from the report or add several additional ones. Simply choose available columns from the list. Enable advanced mode to get more options for adding columns.
How to filter data in Sales by product report
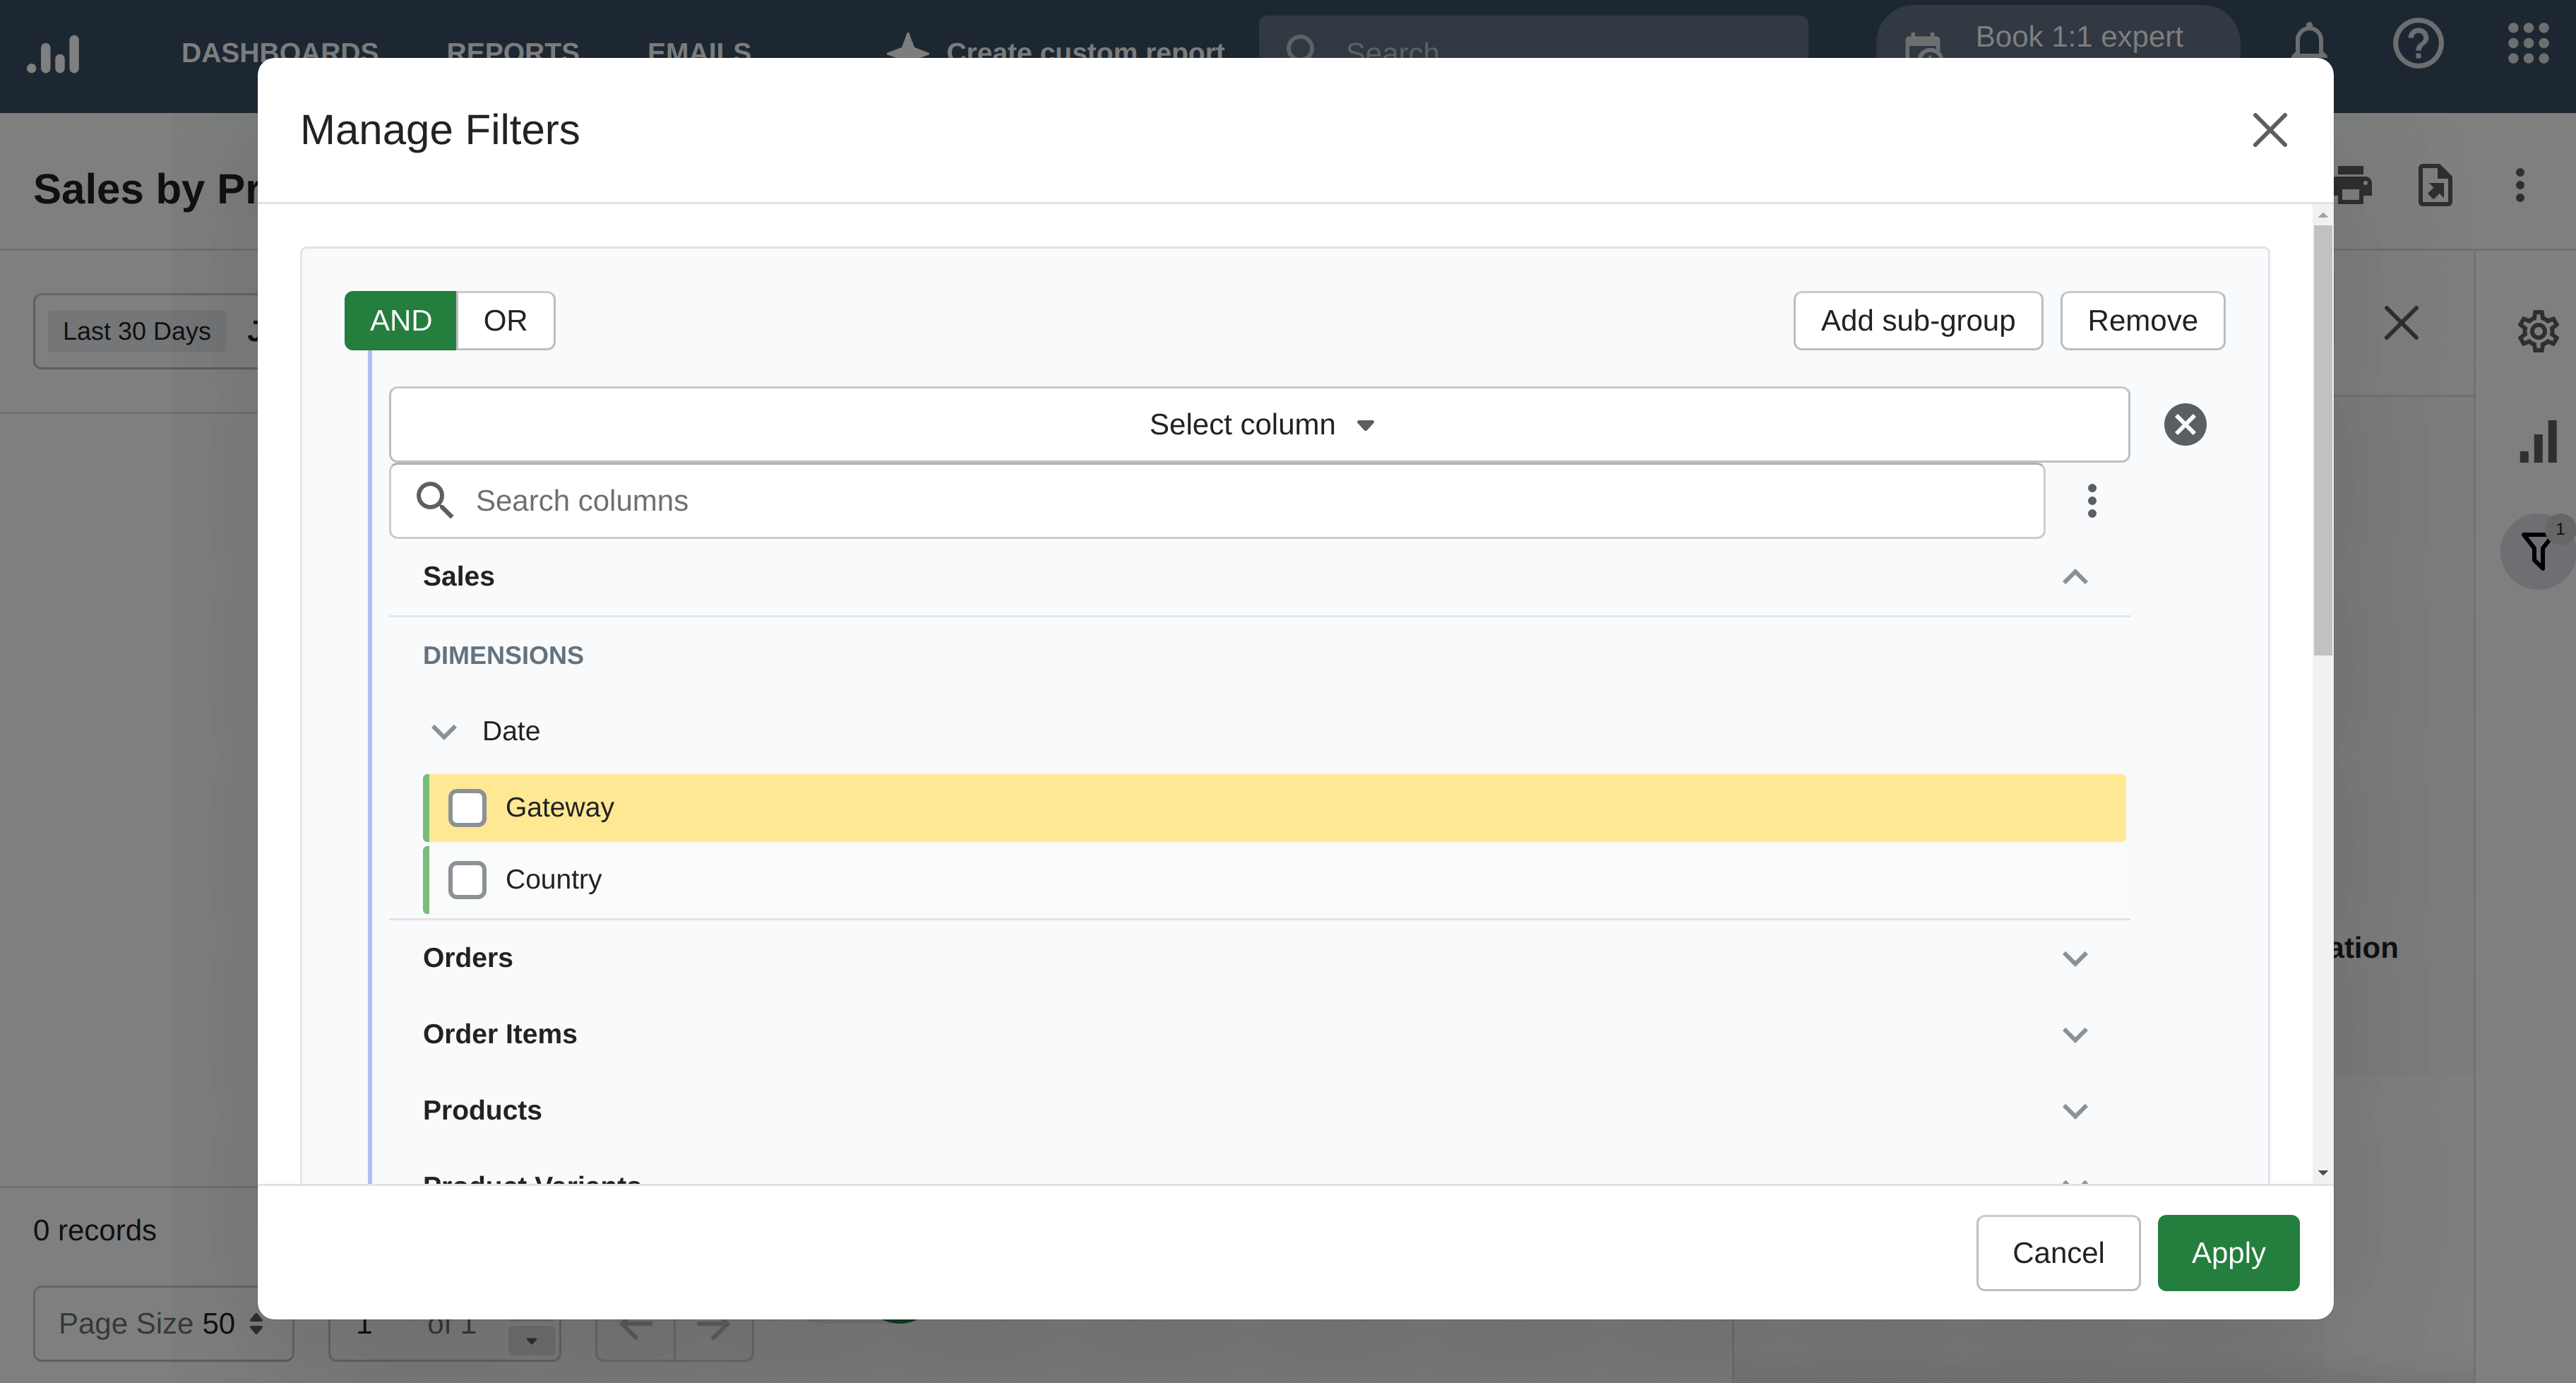
The Sales by product report can display exactly the data you need by filtering out the irrelevant information.
Use filters to display the data based on conditions. For example, you may filter out from the report all products that do not belong to a specific product type. Another example is filtering out by price.
How to display Sales by product report as a chart
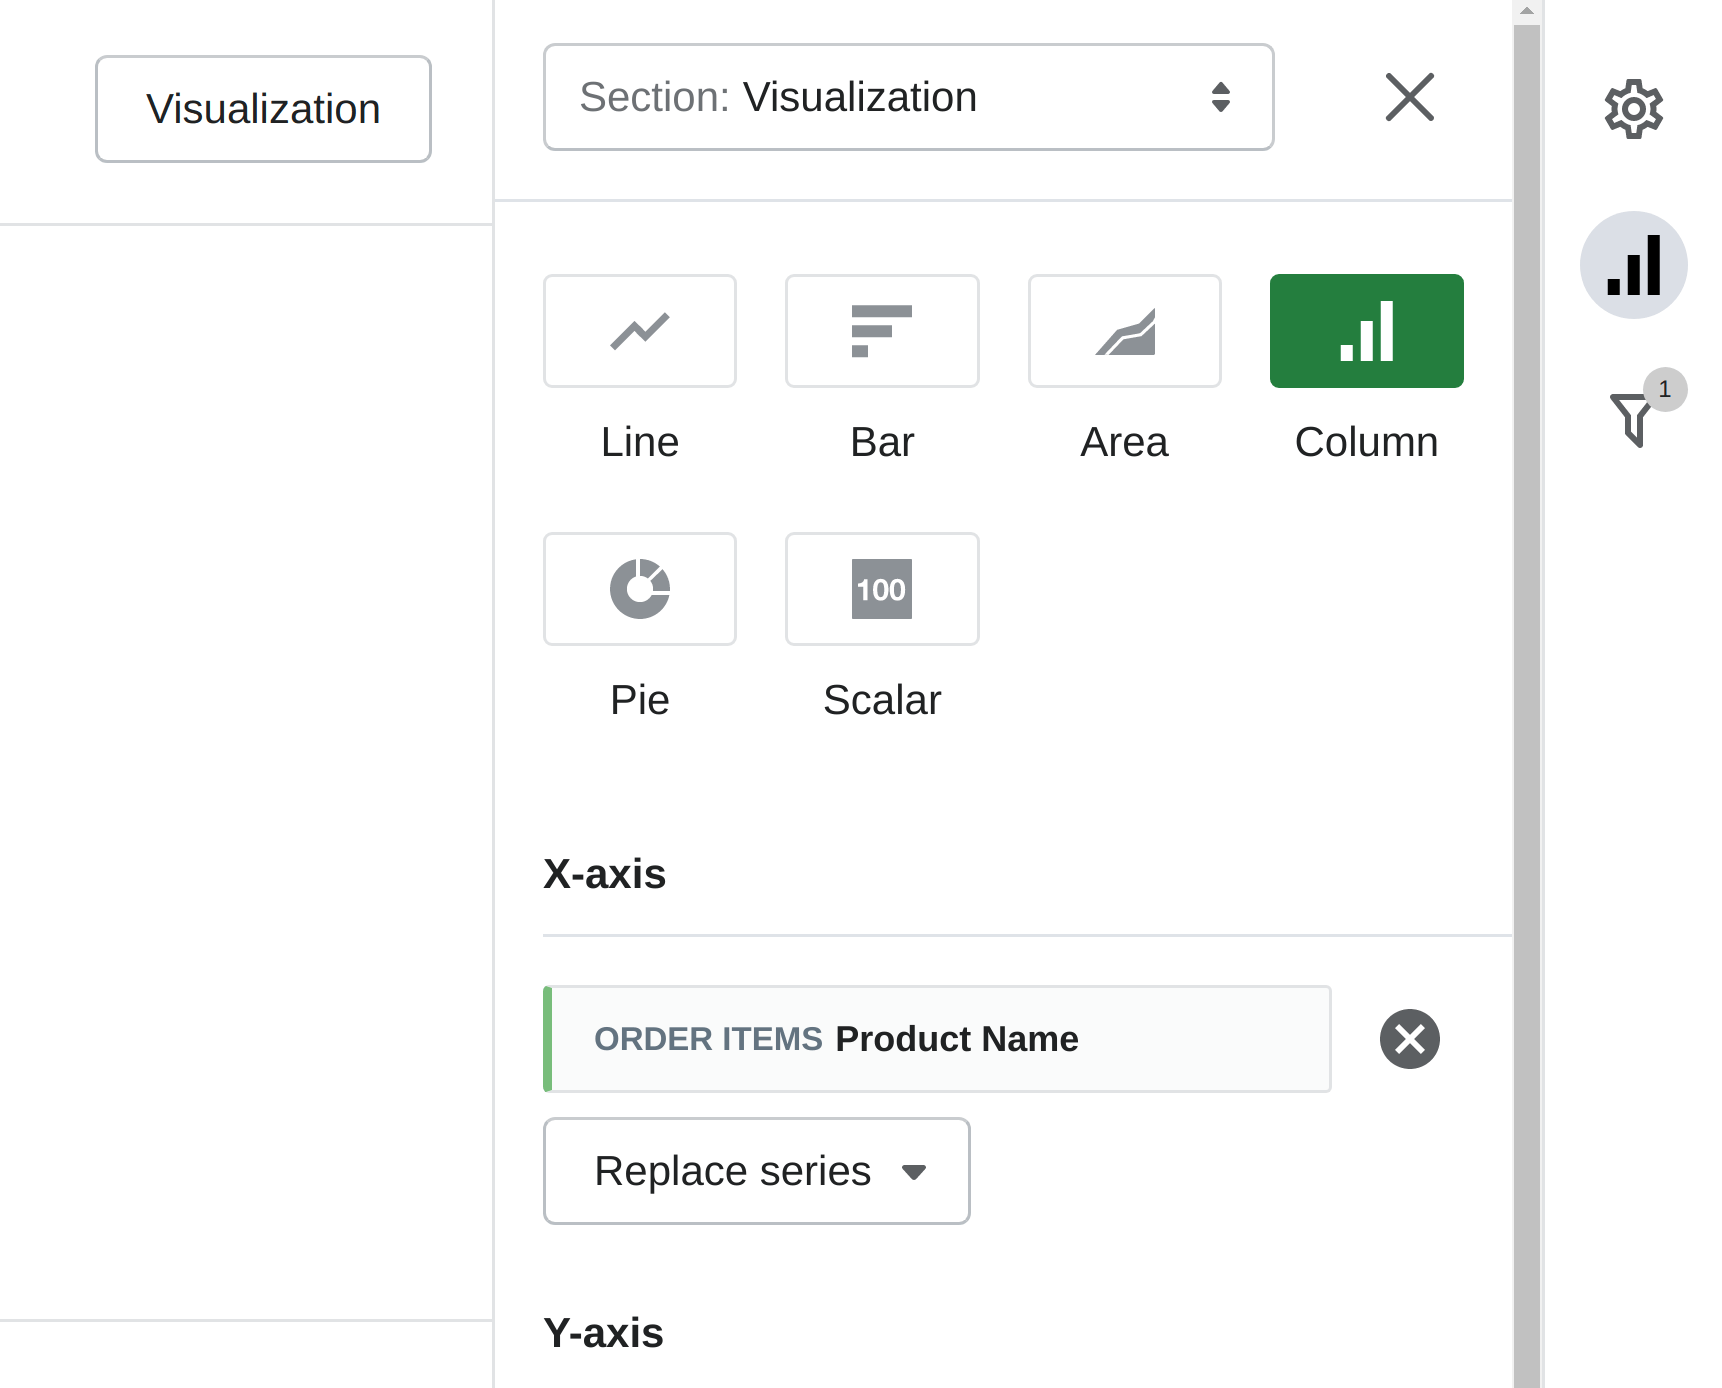
By default, the Sales by product report is displayed as a table filled with numbers. This may be convenient to see the raw data on exact products. However, to spot any possible sales trends, it may be better to change visualization format from table to chart.
With the Advanced Reports app, you can display your sales data in several graphic types: line, bar, column, area, pie, scalar. You can modify the X and Y axes, replacing the existing one with another or adding some data column for visualization.
How to export Sales by product report
With the Advanced Reports app, you are free to view the report in any other apps in addition to the admin panel of your store.
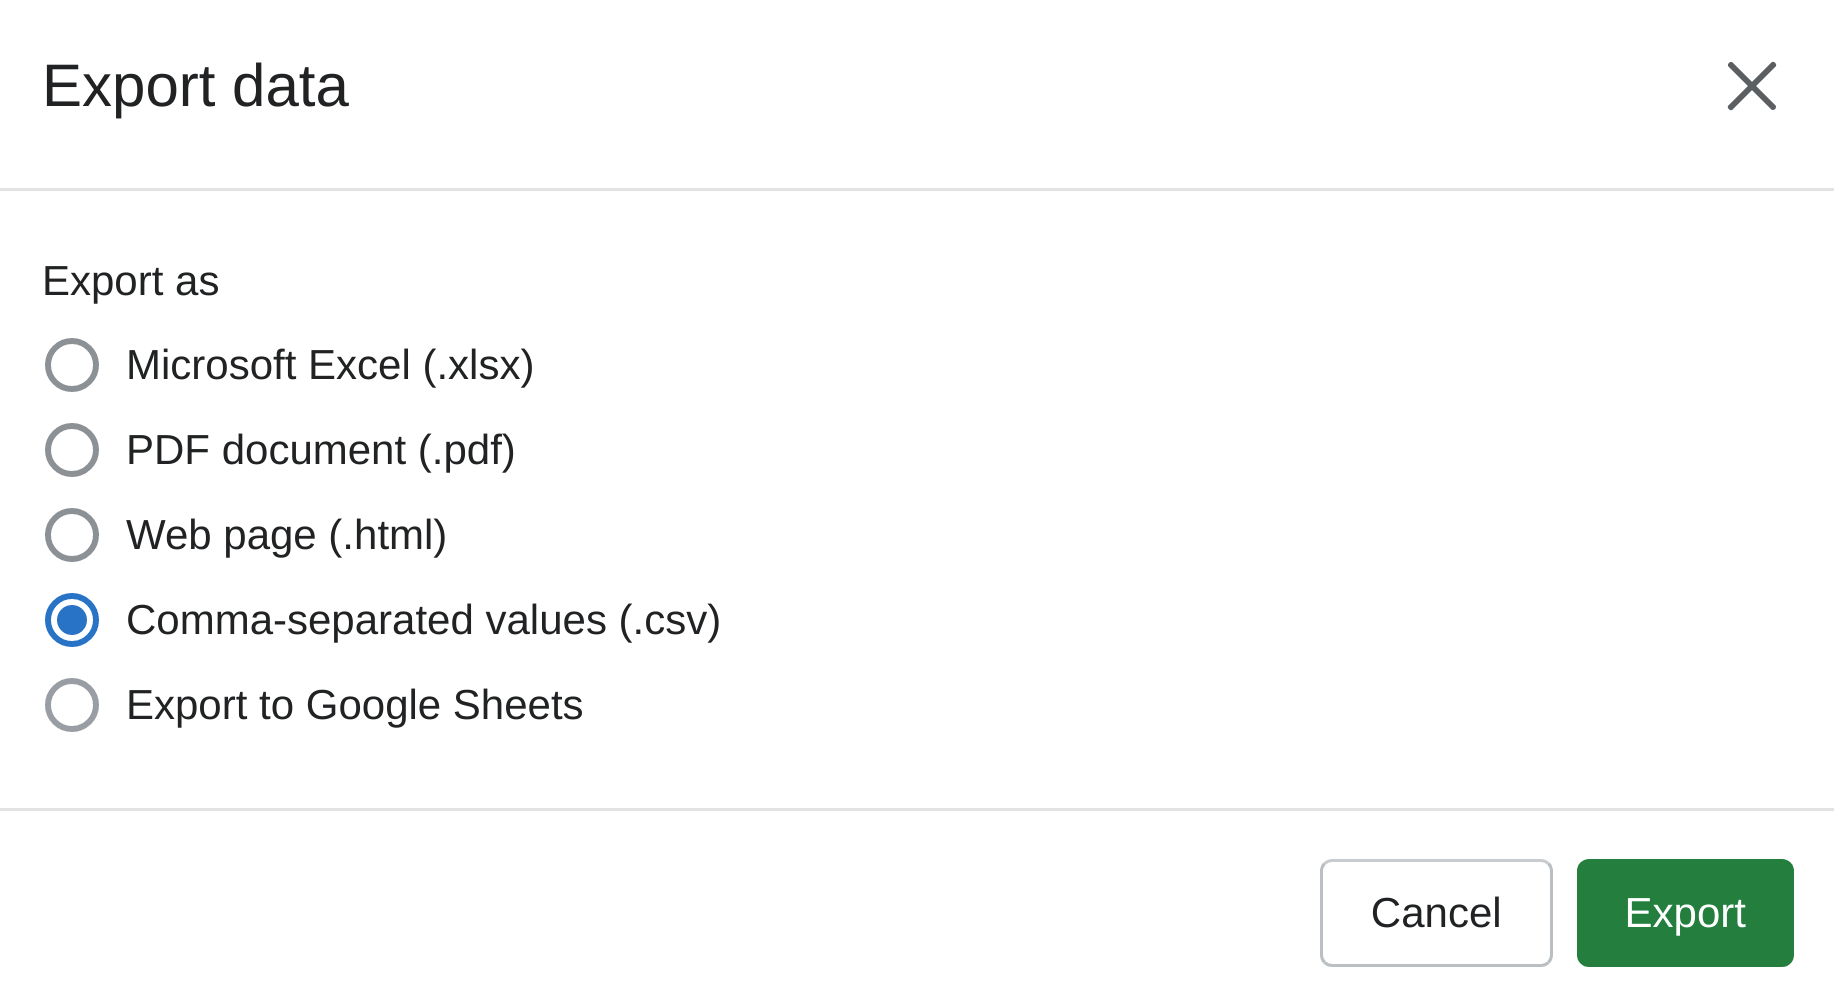
You have several options for exporting the report data with a button click. All you have to do is to select the data exporting format from the list of available: Microsoft Excel, PDF, web page HTML, CSV, Google Sheets.
Additionally, you can print the report on paper directly from the Advanced Reports app.
How to use sales by product report
The Sales by product report provides an immediate view of sales for the selected time range. Here are several examples of how to use this report in practice.
Comparing current vs last year sales by product
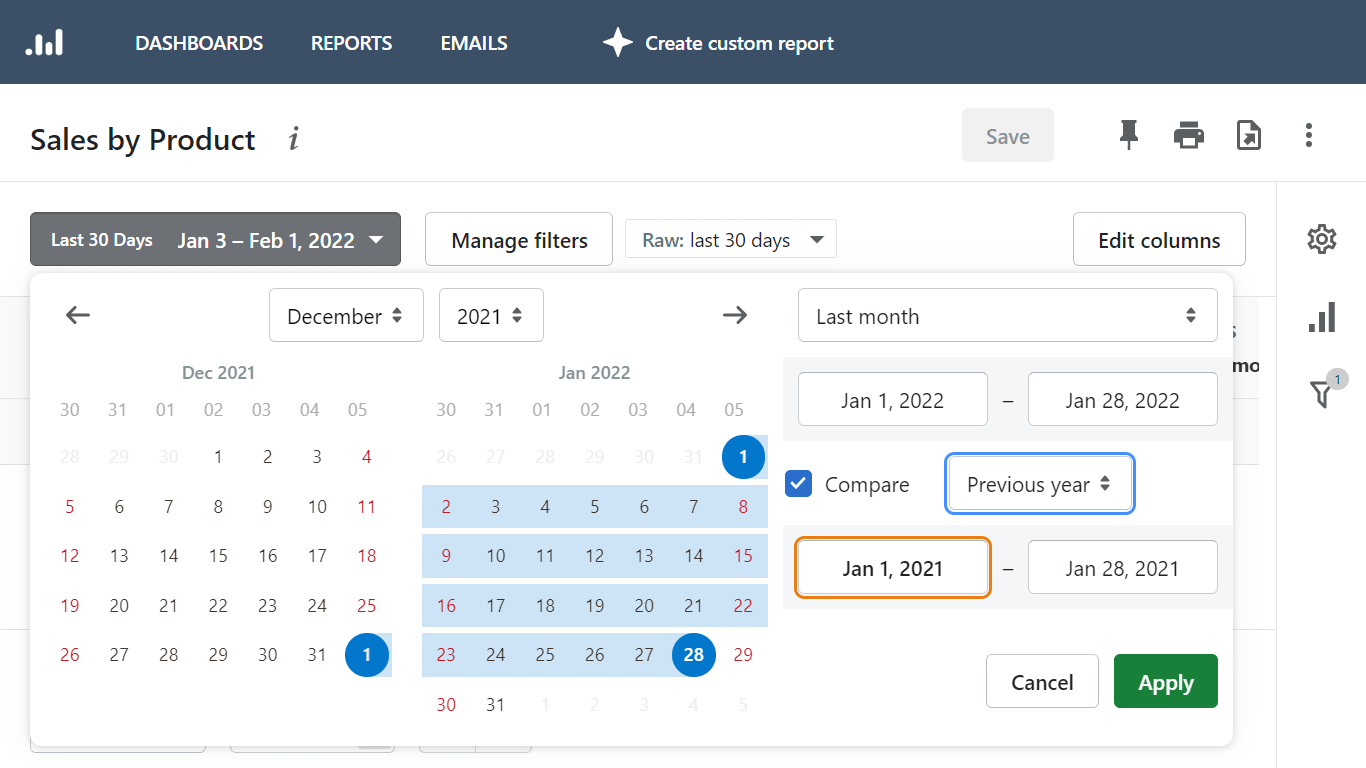
To get an understanding of how sales are going, it is helpful to compare current sales data with the sales data for the same period last year.
When generating a sales by product report in the Advanced Reports app, click the checkmark for generating a comparison report.
Select the current period, for example, today, last week, month, year to date, last 7, 30, 90 days, custom time range. Then specify the previous period for comparison: the previous period, the previous year, custom range.
How to see best and worst-selling products
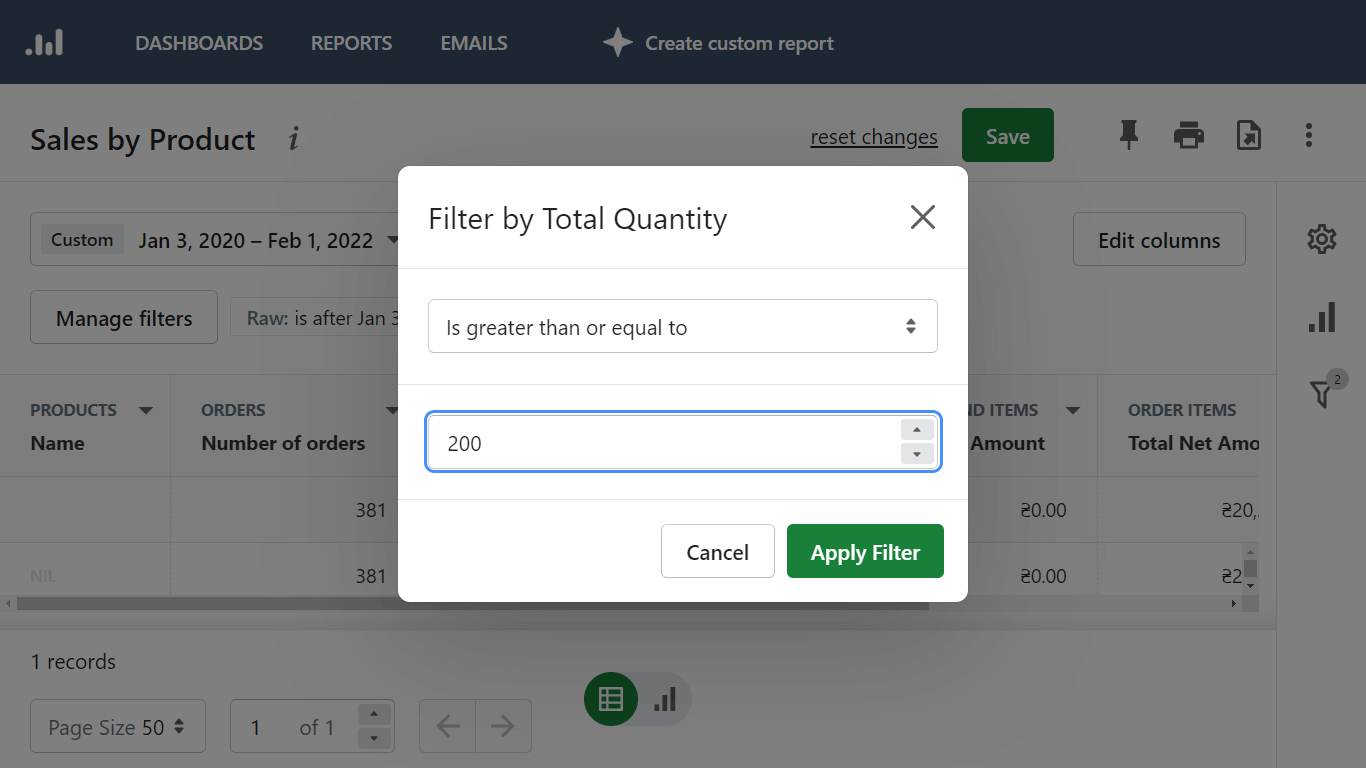
The Total Quantity column can be used as a filter for getting the products that have a specific number of sold items. Click on it to sort in descending order to see the item with the biggest number of sales – it would be your best-selling product. Sort in ascending order to see the worst-selling product first.
In order to see the bestseller product for a chosen time range, filter the report by the Total Quantity column and set the filter condition to is greater than or is greater or equal to and then set the number of sold items you consider to relate to a bestseller.
Keep in mind that the report is built for a specific time range, so the bestseller number for a day will be different when the report is generated for a month or year.
How to see geographical sales by products
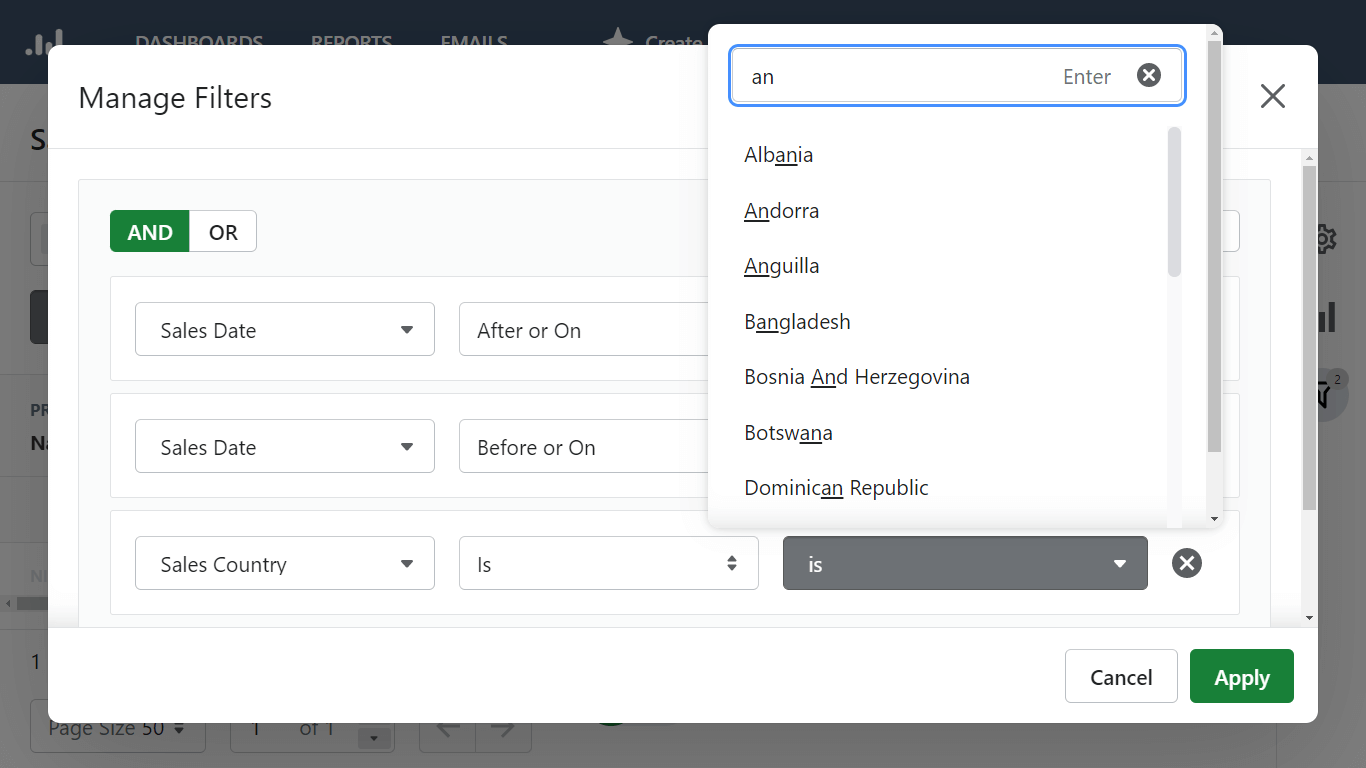
You can easily know where your customers come from. Simply use the location filter when generating a sales by product report.
Navigate to Locations filter to filter out sales by city or province. Use the filter in Sales section to filter out data by countries.
You can also get a live view of your sales geography by utilizing a Live View analytics option default Shopify provides. It shows orders and visitors on a global 3D map in almost real time.
How to see sales by products with discounts
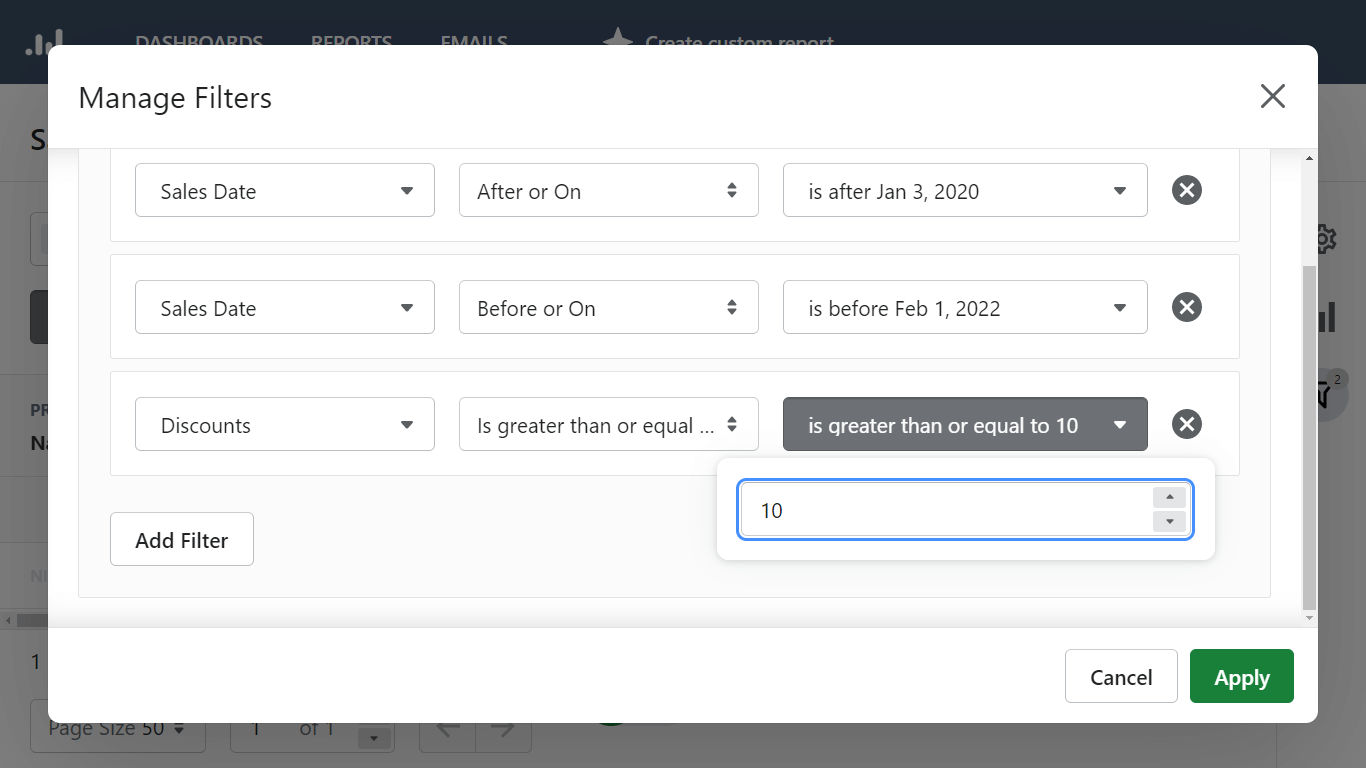
Discounts are a powerful tool for increasing sales, and with the Advanced Reports app, you can see exactly how effective they are in your store.
Add a filter by discounts and set the filter condition to get a view of the products that were sold with discounts.
Advanced Reports app allows tracking sales by products with discounts by the discount code, discount value, average, and total discounts.