Having accurate stock data is essential for a meaningful ABC analysis, as it ensures your ABC classification is based on real inventory figures. ABC analysis in inventory management is a way to rank products by importance: typically, A-grade items (the top ~20% of SKUs) generate ~80% of revenue.
Why the Shopify ABC Analysis Report is Important
For a Shopify store, an ABC report highlights which few products drive most sales. Without it, you might overstock slow movers (C-grade) and understock best-sellers (A-grade). Mipler's ABC report automates this breakdown: it sorts each product variant into A/B/C based on revenue share, so you instantly see where your profit is coming from.
Benefits of Using the ABC Analysis Report
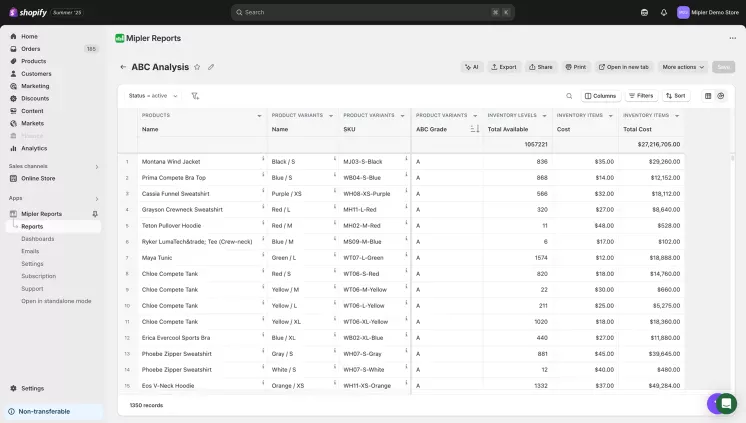
The Mipler ABC Analysis report assigns each product variant an A, B, or C grade by revenue. This visual summary makes the advantages of ABC analysis of inventory management clear. The main benefits include:
- Focus on Top Products: Identify the small set of A-items driving ~80% of sales. Keeping these in stock and promoting them ensures maximum profit using Shopify ABC analysis by product.
- Optimize Inventory Costs: Class C items (only ~5% of revenue) can be de-emphasized. By cutting excess C-stock, you free up cash and cut holding costs.
- Accelerate Turnover: As Mipler notes, concentrating on fast-selling items speeds up inventory turnover, turning goods into cash more quickly.
- Data-Driven Decisions: Instead of guesswork, use clear insights to adjust purchasing and marketing for each product tier.
- Save Time with Automation: Mipler's pre-built ABC report needs just a click – no manual spreadsheets. You get instant results and can export or schedule the report for regular delivery.
How the Shopify ABC Analysis Report Helps You
ABC analysis in inventory management becomes far more powerful when paired with real data. Here's how Mipler helps you turn insights into action:
- Smart Distribution: A-class product "Wireless Earbuds" makes $24,000/month, with 60% of sales from the West Coast. By shifting 70% of inventory to that region, the merchant reduced backorders by 15% and improved delivery speed.
- Targeted Marketing: B-class "Smartphone Tripod" was underperforming at $750/month. A promo campaign raised it to $1,200 (a 60% increase) by bundling with higher-demand A-class items. C-class items were cleared via flash sales, freeing up shelf space.
- Efficient Resource Allocation: A-class SKUs (150 out of 1,000) generate 80% of revenue. These are now managed by senior staff. C-class SKUs (600 items, only 5% of revenue) are assigned to junior staff or reviewed for discontinuation.
- Strategic Purchasing: A-items restocked weekly, based on sales velocity. C-items are reordered biannually, or not at all. One merchant freed $18,000 in capital by cutting dead stock.
Create the ABC Analysis Report on Shopify with Mipler
Mipler makes generating this report quick and simple. Just follow these steps:
- Open Mipler in your Shopify admin (after installing the app).
- Find the ABC Analysis Report in Mipler's library.
- Select your date range (e.g., today, last 7 days, last month).
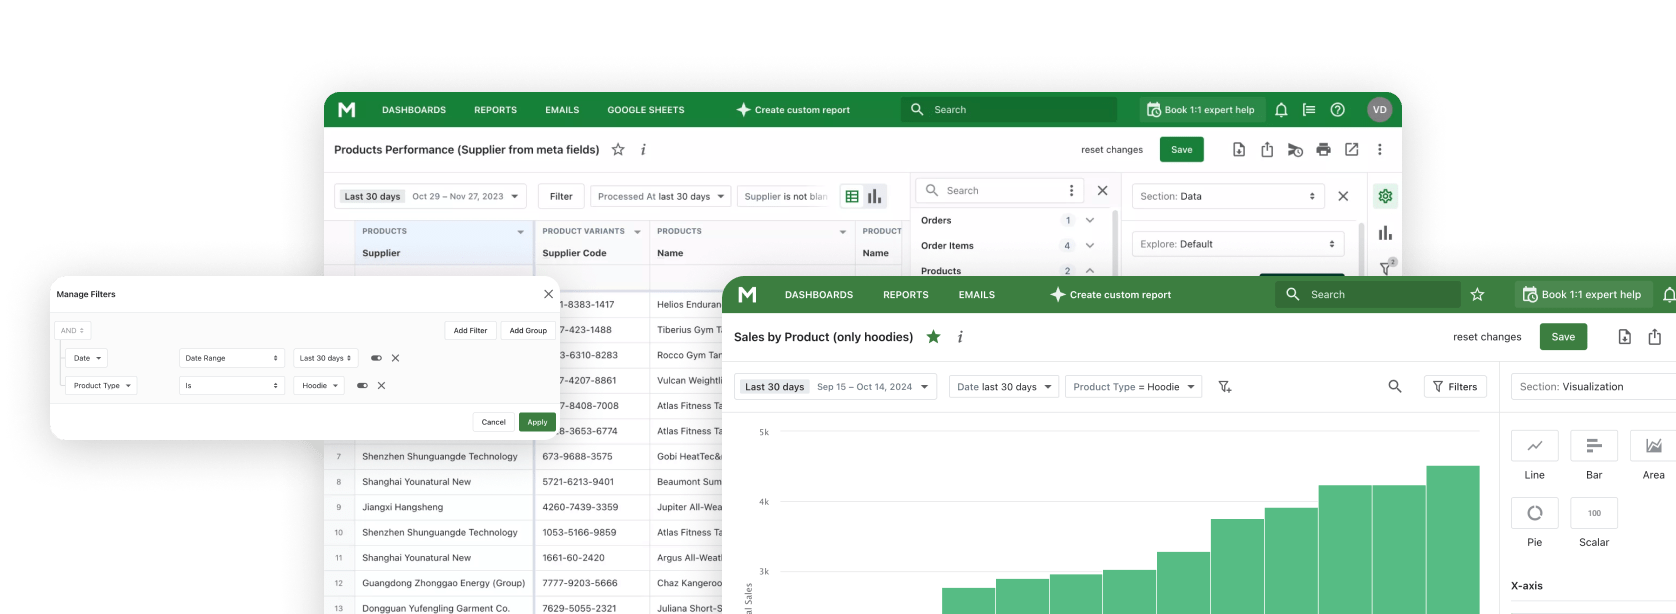
- Apply filters if needed – for example, filter to see ABC inventory management in less than 24 hours for a specific name, SKU or ABC Grade.
- Run the report to instantly view your hour-by-hour breakdown of your report. You'll get a table of every hour (00:00 to 23:00) with preferred metrics.
That's it - in a few clicks, you have the detailed ABC Analysis Report.

Automate Your Shopify ABC Analysis Report to Optimize Your Store
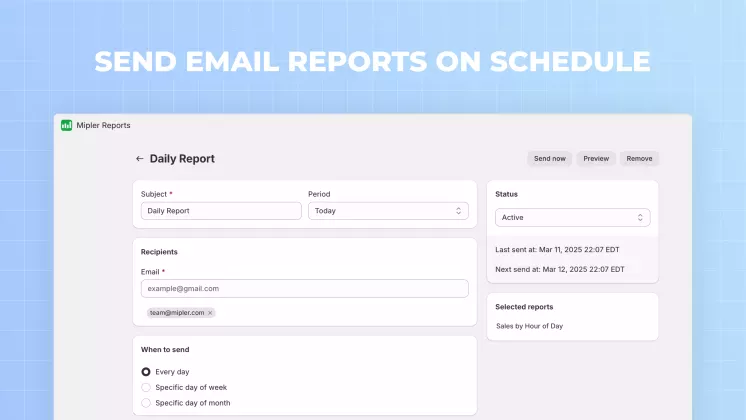
Another advantage of Mipler is the ability to schedule reports. You can set up your Shopify Sales Reports to be emailed automatically on a schedule. Automation saves time and ensures you never miss important changes. Instead of manually running reports, you'll always have the latest store results delivered. This means you can react quickly to trends and focus on strategy, while Mipler handles the legwork of reporting.

Important
Regular ABC analysis is crucial for any store's inventory strategy. Use it alongside other Shopify Reports (like sales trends and customer analytics) for a full view of your business. Mipler's suite of Inventory Reports and Shopify Sales Reports work together to keep your store optimized. Thanks to automation, once set up, these reports update on schedule so you can always act on fresh data.
FAQ
What is an ABC analysis report, and why is it useful?
An ABC analysis report classifies inventory into three categories based on their impact on revenue:
- Class A: The top ~20% of products that generate approximately 80% of your revenue.
- Class B: Average-performing products with moderate impact.
- Class C: The majority of products that contribute the least to your revenue.
This classification helps you identify the most important products in your inventory.
By prioritizing A-items, you focus on what drives profit. By deprioritizing C-items, you reduce overstocking and waste.
In short, ABC analysis applies the 80/20 Pareto principle to your products so you're never in doubt about where to focus your efforts.
Why should I run an ABC analysis report for my Shopify store?
Using ABC analysis provides you with practical information on inventory and sales. It identifies your fast and slow items, so you know what to stock, market, and price. As an example, when a product is A-grade, you can make sure that it does not run out of stock or advertise it more actively. In case it is C-grade, you can lower its reorder quantity or conduct clearance offers. These categories are automatically highlighted in the reports of Mipler, and they help you to avoid overstock and raise turnover.
How do I create an ABC analysis report with Mipler?
On the Shopify admin, go to Mipler > Reports > Select the ABC Analysis report, set the date range and any filters, and run it. The application will immediately determine the sales share of each product and grade it A/B/C.
How often should I run the ABC analysis report?
The stores with high volumes may perform the ABC analysis on a weekly or monthly basis, while smaller stores may perform it every quarter. The trick is to review it every time your sales patterns change. The positive side of it is that Mipler allows you to automate this: you can set the report to run periodically and automatically deliver the results to you or your team.
