The constant growth of the e-commerce industry has led to the gradual adoption of practices that have proven successful in other sectors. By practices, we mean many processes, reports, metrics, approaches, and more.
Business Intelligence is defined as the process of collecting, analyzing, and interpreting data to use the results in the decision-making process. In the context of e-commerce, business intelligence aims to leverage available data to provide insights and adjust strategies for the optimization and growth of e-commerce businesses.
Business Intelligence involves collecting, analyzing, and interpreting data to inform decision-making.
While Business Intelligence may seem abstract, in the case of ecommerce, its tasks boil down to supporting every aspect of an online store's operations:
- Sales
- Customers
- Marketing
- Inventory and logistics
- Market trends
Business Intelligence (BI) and Business Analytics (BA)
In general interpretations of these terms, the difference between these two concepts is significant. However, in the context of ecommerce, the distinction is less pronounced and can be narrowed down to several definitions:
- BI typically focuses on current Key Performance Indicators (KPIs) and the calculation of numerous metrics, thus aiding decision-making based on current and historical data;
- BA, on the other hand, concentrates on deeper analytics, identifying trends, and patterns, constructing behavioral models, and more.
- BI largely impacts the current or operational activities of an online store;
- BA, in contrast, has more influence on strategic aspects as it studies longer-term trends.
Typical Business Intelligence Reports for Ecommerce
In e-commerce, BI is utilized to generate an extensive array of Shopify Reports. Since the full utilization of BI capabilities involves working with a broad spectrum of data, creating a custom data warehouse is one way to obtain useful and accurate insights from BI.
Data is the new oil. It's valuable, but if unrefined, it cannot really be used.
While there isn't a definitive list of reports, as they may vary based on the type of products sold, and suppliers, basic reports can be enumerated.
Sales Reports
Shopify Sales Reports are the most common example:
- General sales for a specific period: A typical report displaying sales by day/week/month over a fixed period;
- Shopify Sales by Product Report: Identifying the most popular products;
- Shopify Sales by Collection Report: Discovering the most popular product groups;
- ABC report: Segmenting all products into three groups
(A - contributing 70% of sales, B - 15%, C - all other products).
All these reports can be linked to data from web analytics, allowing an understanding of the conversion for each product. This way, fundamental reasons for good or poor sales of specific products can be identified.
Conversion Reports (Web Analytics)
This set of reports enables a detailed tracking of user behavior during visits to an online store.
The conversion rate itself determines how effectively an online store transforms visitors into customers.
Since users go through several stages during the selection and purchase process, the primary focus is on exploring the entire sales funnel, and conversion of transitions to the next stage.
The result of working with conversion reports is the improvement of specific parts of the online store, such as the product list, product page, filtering, search, order processing, FAQ placement, and similar elements.
Customer Reports
This group of BI reports includes a set of reports that analyze customer behavior. Typical examples include calculating Customer Lifetime Value (CLV), RFM analysis, and segmentation based on various parameters. Shopify Sales by Customer Report, in turn, form the foundation for building or enhancing marketing initiatives.
Marketing Reports and Advertising
This extensive group of reports calculates dozens of indicators, with ROI being a key one. ROI can be calculated both overall and for each specific marketing channel for optimization purposes.
It is worth noting that to build this group of reports, data stored only in the store's database (Shopify, Magento, or other platforms) would be insufficient.
Data from various marketing and advertising platforms in use also needs to be integrated.
At this stage, considering the creation of a custom data warehouse, where information from different sources is stored, becomes essential. The so-called ETL process (Extract, Transform, Load) becomes useful here.
Financial Reports
The analysis of profits and expenses, margins, and profitability in e-commerce is a cornerstone of effective business management. These are also elements of BI.
Reports can have both a general view and focus on specific product groups, vendors, etc.
It's worth mentioning that a whole range of tax reports also falls into this group, which should receive special attention.
Inventory Reports and Forecasting
This group of reports covers available inventory and its effective management it (if e-commerce operates with its inventory). Examples include Shopify Inventory Value Reports, Cost Reports, Inventory By Locations, and Shopify Inventory Planning Reports, among others.
Support Reports
The level of customer satisfaction with service is crucial in shaping a brand and optimizing marketing activities. Therefore, reports that output indicators of customer satisfaction with communication with the support service, NPS, or similar metrics must be on the monitoring list.
Explore related reports
What about Data?
As Business Intelligence (BI) encompasses various areas, quality analysis also requires a substantial amount of data.
Relying solely on data stored in the store's database is not sufficient.
Additionally, it's essential to consolidate data from various analytical and marketing services under a unified roof. In BI, this is accomplished through a Data Warehouse.
A Data Warehouse serves as the primary data provider for BI, incorporating data from the store (customers, orders, carts, products, inventory) and third-party services such as Mailchimp, Facebook, Google Ads, Google Analytics and Search Console, Twilio, Help Scout, Zendesk, and similar platforms.
A Data Warehouse is the primary data provider for Business Intelligence, containing information from various available data sources.
Once the data is unified into a single database, both simple reports and blended reports, where data is sourced from multiple channels, become feasible.
BI Tools for Ecommerce
First and foremost, it's noteworthy that most e-commerce systems (Shopify, Magento, Shopware, Bigcommerce) have built-in reporting capabilities, often fulfilling the basic requirements for BI. For additional enhancements, one can turn to solutions specifically designed for these platforms:
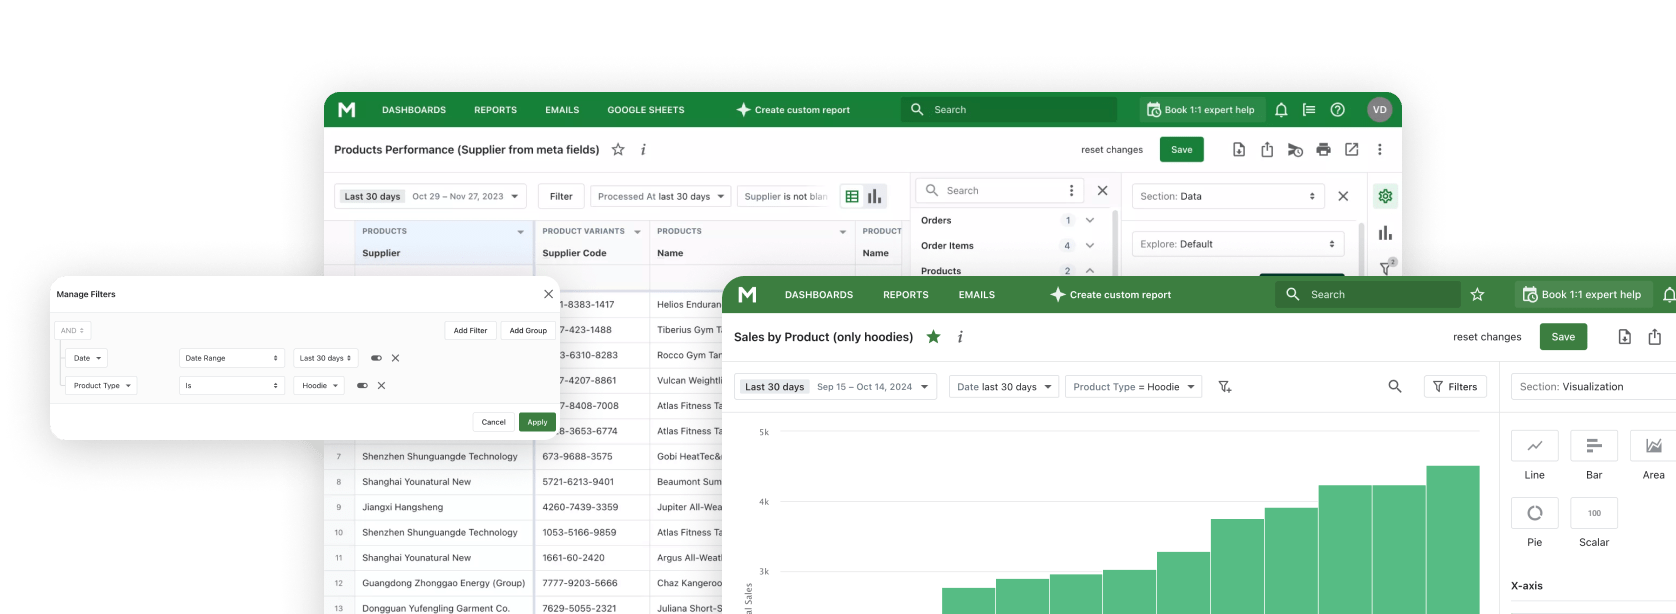
- For example, for Shopify, leveraging Mipler Shopify Custom Report would be a significant leap in Business Intelligence;
- Magento users can consider a similar extension like Mirasvit Advanced Reports.
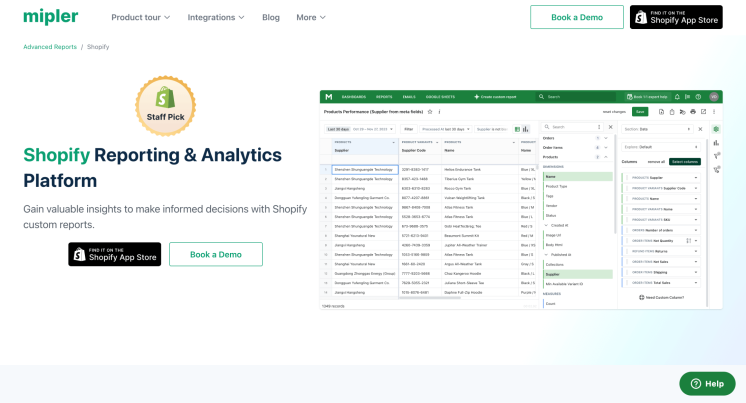
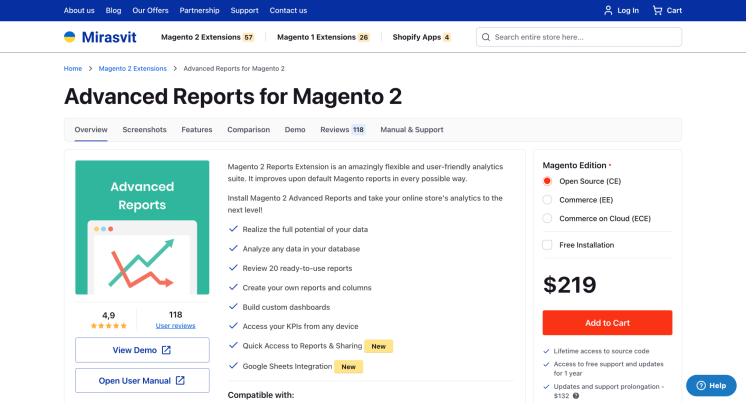
The advantages of these solutions include relatively low cost, seamless integration with ecommerce systems, and ready-made basic configurations and reports. These systems also offer additional features such as customizable Shopify Dashboards, email notifications, report sharing, and integration with Google Sheets.
If a more comprehensive (and costly) solution is required, building a custom Data Warehouse using Extract, Transform, and Load (ETL) processes and integrating professional BI analytics systems like Microsoft Power BI or Google Looker Studio should be considered. Working with these systems demands more investment in the launch phase and building a foundational set of reports. However, in the long run, you gain a solution that nearly completely addresses data analytics (BI) needs.
Final Thoughts
BI is about data, answers, and decisions based on data. Every e-commerce business utilizes BI to some extent, but for continuous growth, decisions should increasingly be data-driven. This is achievable with the implementation of a comprehensive BI approach.
If you're eager to learn more about BI in e-commerce, check out some of these other posts:
