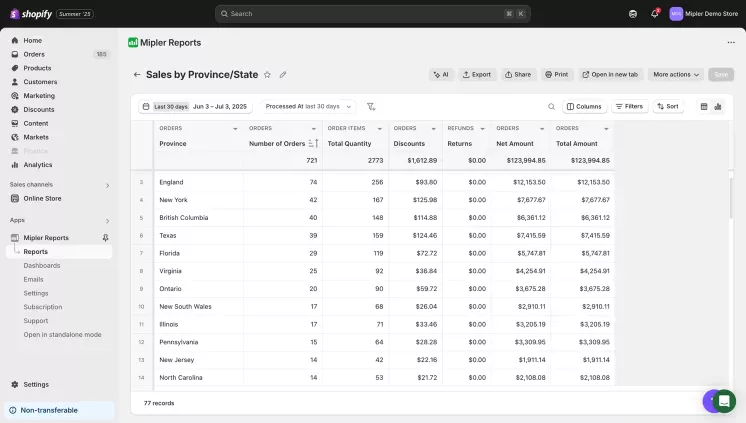
Understanding where your customers come from is crucial for any Shopify store owner. A Shopify sales by state report shows how your sales break down by region, giving you deep information about which states are your biggest markets. Instead of guessing where to allocate marketing budgets or inventory, you can rely on data. With Mipler's Shopify Sales Reports, generating a sales by state report on Shopify will become as simple as possible.
Why the Shopify Sales by State Report is Important
Knowing your sales by state helps you make proper decisions. For instance, if any state will be drained your revenue, you might stock warehouses there or run targeted ads. A sales by state report in Shopify highlights regional trends, letting you focus marketing dollars on states where sales are growing or adjust inventory to avoid stockouts. It also ensures compliance with state-specific taxes and shipping rules. In short, this report turns raw data into strategy. By using Mipler, even stores on basic Shopify plans (which lack advanced built-in reports) can generate this breakdown easily.
Benefits of the Sales by State Report on Shopify
- Targeted Marketing: Focus ads and promotions on states with high sales potential or growth. For example, if a sales by state Shopify report shows New York orders doubling quarter-over-quarter, you know to allocate more budget there.
- Inventory Optimization: Ship products closer to top-performing regions to cut delivery times and costs. With Mipler's Shopify sales report by state, you can cut spendings for specific states account for 20% of sales and stock its closest warehouse accordingly.
- Tax and Compliance: Ensure accurate state tax reporting. A complete sales by state report in Shopify helps you prepare state sales tax returns by summarizing how much sales tax was collected in each state.
- Team Alignment: Share clear data with your team. Mipler's custom Shopify Reports visualize state-level data so everyone grasps your market performance at a glance.
How the Shopify Sales by State Report Helps You
Imagine a store with $50,000 in monthly sales. Mipler's Sales by State report might show that California made up $15,000 (30%), New York $6,000 (12%), and Texas $4,000 (8%). Armed with these numbers, you could adjust strategies:
- If California's share jumped 5% from the last month, you might increase ad spend there or plan promotions.
- Knowing New York contributes 12% means you might open a new fulfillment center in the Northeast to speed up shipping.
- For taxes, if Texas sales are $4,000 and the sales tax rate is 8.25%, you must report about $330 in tax to Texas.
A sales by state report in Shopify can also reveal unexpected trends: maybe Florida sales grew 15% year-over-year, alerting you to a new market opportunity. Mipler makes it easy to spot these trends with clear state-by-state tables and graphs.
Create the Sales by State Report on Shopify with Mipler
Mipler makes generating this report quick and simple. Just follow these steps:
- Open Mipler in your Shopify admin (after installing the app).
- Find the Sales by State Report in Mipler's library.
- Select your date range (e.g., today, last 7 days, last month).
- Apply filters if needed – for example, filter to see Sales by State Report in less than 24 hours for a specific city, state, or country.
- Run the report to instantly view your hour-by-hour breakdown of your report. You'll get a table of every hour (00:00 to 23:00) with preferred metrics.
That's it – in a few clicks, you have the detailed Sales by State Report.

Automate Your Shopify Sales by State Report to Optimize Your Store
With Mipler, you can automate the Sales by State Report. In the app's schedule settings, set up a recurring email for the county tax report. For example, have the system email you a PDF of the Shopify sales tax report by county every month or quarter. This way, you'll always have the latest sales by state data without any manual work. Automating your reports ensures you always stay on top of these numbers.

Important
Make sure your Shopify store's location and state settings are correct so that Mipler reports can capture regional sales. Mipler pulls data directly from Shopify, so if your Shopify admin has orders tagged with the right states and provinces, the report will be precise. Always double-check that orders with missing addresses are minimized, so no sales are omitted from the state breakdown.
FAQ
What is a Shopify sales by state report?
It's a report that breaks down your store's sales (revenue, orders, etc.) by U.S. state or region. This lets you see which states generate the most sales or profit. A sales by state report Shopify format typically lists each state alongside its sales totals, orders, and other metrics.
How can I generate this report on Shopify?
On higher Shopify plans, you can use the built-in Sales reports and export data. On other plans, you'd normally export orders to CSV and filter by state manually. But with Mipler, simply select the Sales by State report template and run it, no CSV cleanup needed. Mipler automates the sales by state report in Shopify creation, even on Shopify's Basic plan.
Why use Mipler for a Sales by State report?
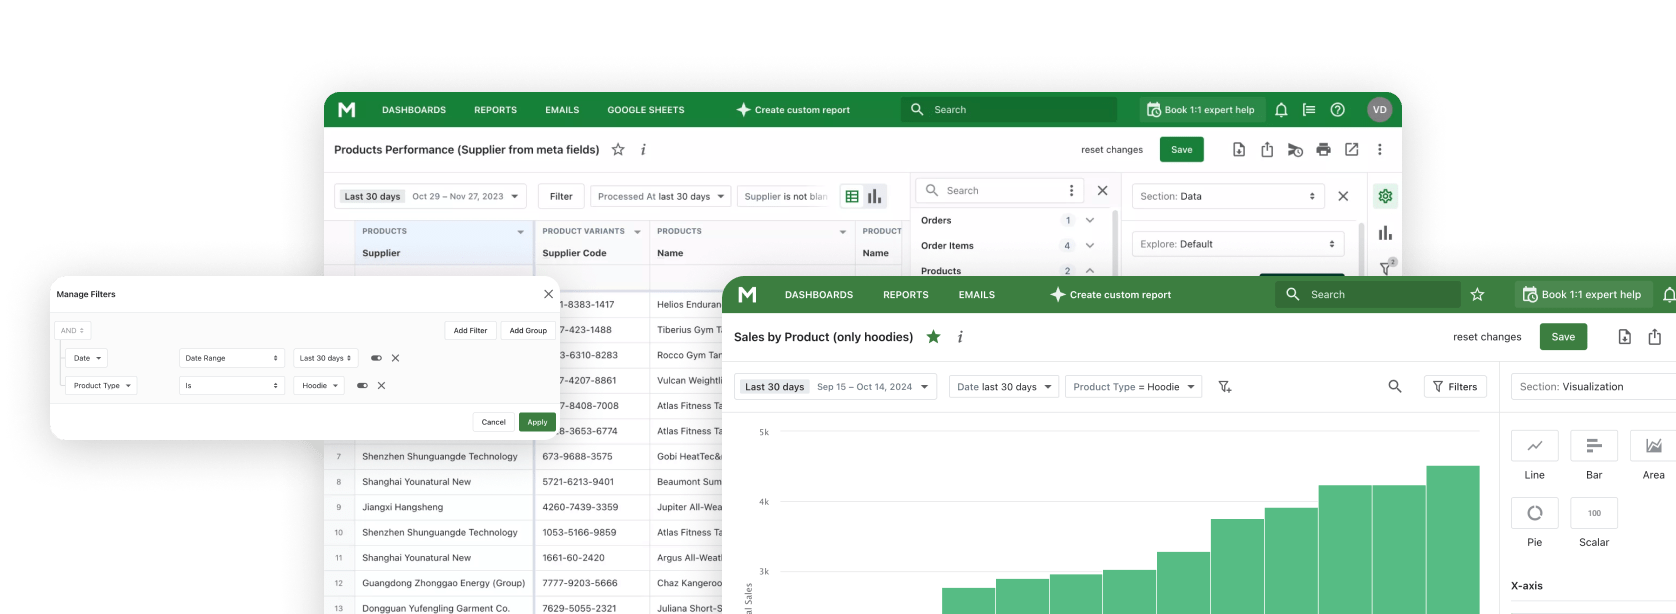
Mipler offers more flexibility and ease than Shopify's basic reports. You get 100+ templates, including a ready-made sales by state report. You can filter, add custom columns (e.g., net sales after tax), and even combine states with shipping zones. Plus, Mipler can schedule reports, send them via email, or sync to Google Sheets automatically. This makes it far easier than wrestling with raw data in spreadsheets.
What insights can I get from a Sales by State report?
You'll see exactly which states are your top markets and how sales change over time in each region. For example, if 40% of your orders come from the West Coast and only 5% from the Midwest, you might focus marketing on expanding in the Midwest. You can also spot anomalies, maybe one state suddenly drops 50% in sales, alerting you to investigate issues like a shipping problem or new competition.
