The last and final step of any successful shopping journey is paying for ordered items. Research conducted in 2023 showed that almost half of shoppers prefer to forego a purchase if they can't use their favorite payment system.
Since paying for an order is one of the most critical stages, the store owner should be informed of the payment gateways customers prefer to use. Promote the gateways that bring the most revenue and investigate those least popular gateways.
What is the Sales by Payment Method Report in Shopify
There are many payment methods, so the report helps to collect information about them in one place. In fact, this is the one of Shopify Reports that helps to evaluate the popularity of payment gateways among your buyers. Shopify reports all information about payment methods, and the Sales by Payment Method Report sorts paid orders by gateway and gives the processed information to store managers and salespeople.
Why Sales by Payment Method Report in Shopify is important
The store will not be able to exist for a long time without adapting to the preferences of customers. This Shopify Payment Transaction Report helps you better understand which payment method brings more customers to the store. Here's another reason this reports important:
- You will see which payment method is most convenient for your customers. Since this is a kind of Shopify Sales Reports, with the most popular method you will get the most profit, because we are the most used.
- You will be able to optimize the ordering process. Make paying with the most popular methods easy. Reducing the average checkout time will definitely raise your store's rating in the eyes of customers.
- Reduce the number of abandoned baskets. Making the most popular payment options available makes it less likely that customers will abandon their cart.
- See the costs of using each payment method. Merchants can analyze transaction fees associated with different payment methods.
What information does the Sales by Payment Method report show
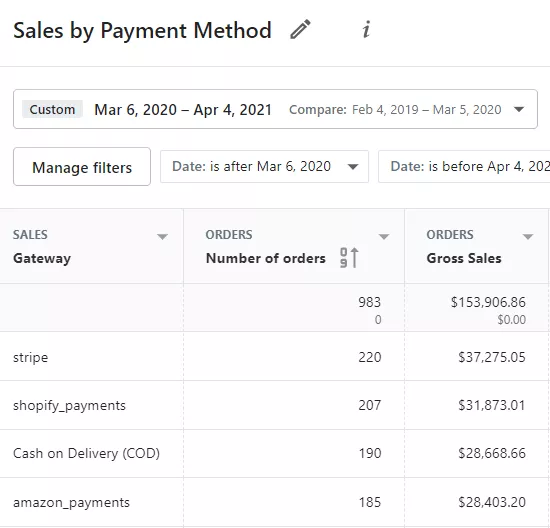
Getting insights on the usage of payment gateways in your store can be done with the help of a corresponding summary. This report opens a view on product sales split by the payment method used during the sale. It is a common report used by store managers and salespeople for achieving versatility in the methods customers may use to pay for purchases.
The executive manager can view information with output by date range. In addition, they can select the time period manually. Typically, the document is formed as a table with each row corresponding to one payment method. The report columns are used to display various sales statistics on this gateway.
Depending on the store's reporting app, it can be possible to transform the report output form from the data table into a graphic chart.
What questions can be answered when viewing the Sales by Payment Method report
Using this summary, the store manager can, in one place, track all information related to the tools used by shoppers to transfer money for their orders. This data can be used to answer such questions as:
- What is the most profitable payment method in your store within the specified time period?
- How often does the popularity of payment gateways change?
- What payment method do customers choose for purchases with discounts?
- How to see payment gateway popularity by country or city?
- What is the customer's lifetime value for each payment method?
- What product types are mainly purchased with the specific payment method?
- What payment gateways are preferred by recurring and new customers in your store?
- What are the total sales for each payment gateway within the specific time period?
The list of answers you may get with this summary can be extended by using additional data columns and data filters.
Similar reports to Sales by Payment Method
Get a clearer view of the financial performance of your store by looking at the sales statistics from another viewpoint. The reporting tool allows doing so conveniently by generating similar reports. A Shopify store owner may use several other sales reports alongside the sales by payment method.
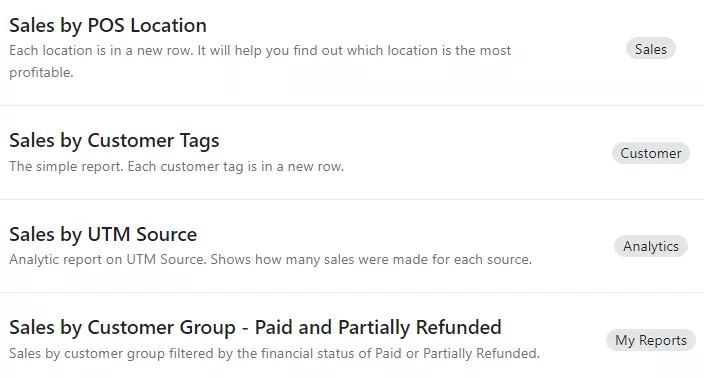
In conjunction with a Product Sales Report, a store manager can often use such reports as:
- By product vendor
- By POS location
- By discount
- By traffic referrer
- By billing location
- By checkout currency
- By customer group
For example, using a summary on sales by POS location can provide insights into what geographical location is the most profitable for your store. Research what payment methods are most widely used in that region and provide customers with them. View if your decision was successful with the sales by payment method report.
Additionally, the store manager may build the sales reports by customer name, product tag, day of the week, UTM campaign, and a dozen other similar reports on sales. The exact list of available reports depends on the utilized reporting app.
Key columns in the Sales by Payment Method report
The default configuration of this summary varies depending on the reporting tool a Shopify store uses. The basic setup of the Advanced Reports app includes such columns as:
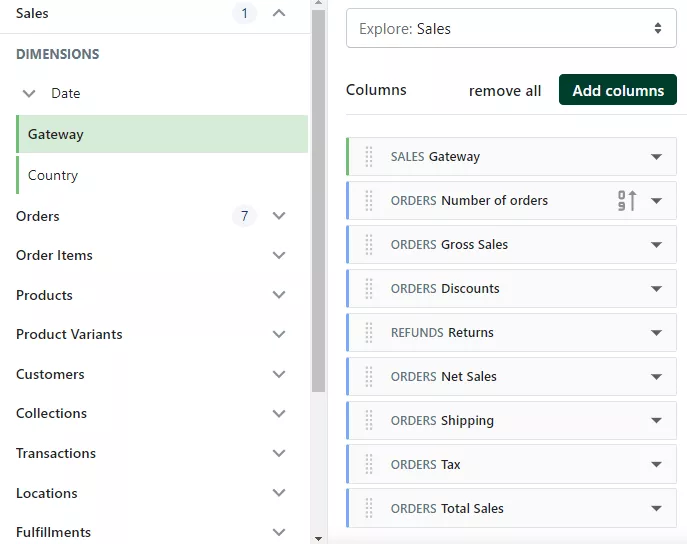
- SALES Gateway
- Number of Orders
- ORDERS Gross Sales
- ORDERS Discounts
- REFUNDS Returns
- ORDERS Net Sales
- ORDERS Shipping
- ORDERS Tax
- ORDERS Total Sales
You are totally free to exclude any of the existing columns from the report or add several additional ones. Simply choose available columns from the list.
Here is how some of the key columns in the default report are calculated:
-
REFUNDS Returns. It is calculated through Refunds Total Gross Amount and Order Adjustments Total Amount data columns.
[REFUNDS Returns] = [REFUNDS Total Gross Amount] – [ORDER ADJUSTMENTS Total Amount]
-
ORDERS Net Sales. It displays what is left after the discounts and refunds are extracted out of gross sales.
[ORDERS Net Sales] = [ORDERS Gross Sales] – [ORDERS Discounts] – [REFUNDS Returns]
-
ORDERS Shipping. Allows tracking the sums on order shipping.
[ORDERS Shipping] = [ORDERS Shipping amount] – [ORDER ADJUSTMENTS Total Shipping Amount]
-
ORDERS Tax. Depicts the sum of taxes excluding the taxes on the refunded items.
[ORDERS Tax] = [ORDERS Taxes] – [REFUND ITEMS Total Tax Amount]
-
ORDERS Total Sales. It is the final default column of the report, which sums net sales, shipping, and tax.
[ORDERS Total Sales] = [ORDERS Net Sales] + [ORDERS Shipping] + [ORDERS Tax]
Variations of Sales by Product Report and what questions they answer
Using filters and sorting options, you can get answers to many specific questions regarding sales. Here are some examples of the report variations.
How to see gateway popularity by country
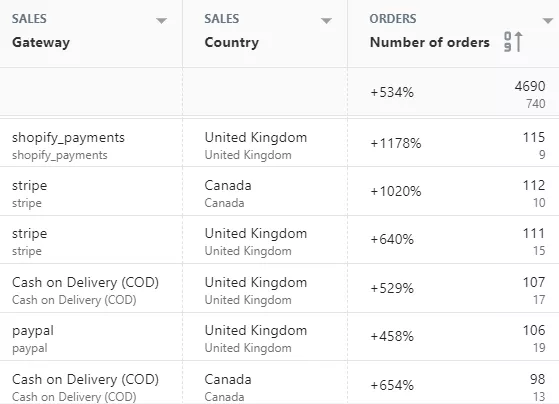
You can easily know what gateways are most commonly used in a certain geographical region. Simply use the location filter when generating a sales by payment method summary.
Navigate to the Locations filter to filter out sales by city or province. Use the filter in the Sales section to filter out data by country.
How to make ABC analysis
The so-called ABC report gives you a different perspective on the payment methods by dividing all gateways into three grades:
- A - generates 80% of revenue
- B - generates 15% of revenue
- C - generates 5% of revenue
From a financial standpoint, it makes more sense to concentrate on A-gateways to get the most profits. Filter by the data in the Total Gross Profit column to see what payment methods fall into the A, B, C range for your store.
Cost of Goods Sold (COGS)
Cost of goods sold (COGS) term stands for the direct cost of making sales. It includes expenses required for making the sale, for example, personnel salary. Use the Orders COGS to get this data column.
First and last purchase date
The data in the Last Ordered table of your store's database keeps track of the dates of the first and last order of products purchased through a particular gateway.
What payment gateway is used mostly for each day of the week
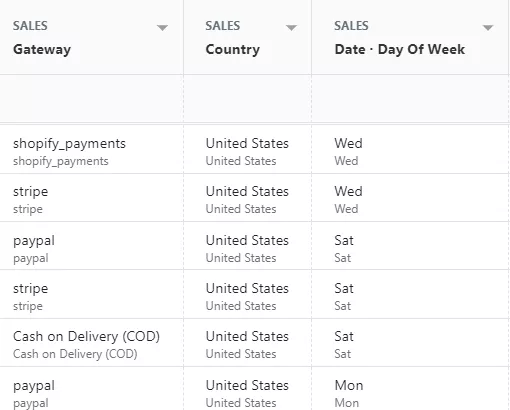
You can easily see the trends on payment infrastructure usage with the sales by day of week info. Add a SALES Date of week column in order to display such data.
Add a TRANSACTIONS Source Name to see the name of the transaction's origin and add a TRANSACTIONS Status to see if the transaction was completed successfully.
Create Sales by Payment Method Report in Shopify with Mipler
Mipler provides a basic Shopify report for payment method. However, each user can add the information he needs for a more detailed analysis:
- Set time filters. Basically, you can report for 30 days. You can report a period of up to several months or a year
- Add new columns. Then you can still other information about sales by payment method. For example, add a shipping location and the entire report will be sorted by that column. Then you will be able to see which payment gateway is more popular in a particular state.
- Upload the report to Google Sheets. Then you can not only make changes to the data, but also provide access to these changes to other employees of the store.
FAQ
What is Shopify Sales by Payment Method Report?
The Sales by Payment Method Report provides a breakdown of your store's sales by the payment methods your customers use, offering insights into customer preferences and payment trends.
Why is Shopify Sales by Payment Method Report is important for my business?
Using this report you:
- Understand customer preferences
- See ways to optimize the ordering process
- You can reduce the number of abandoned carts by making the most popular payment options available.
- You will be able to estimate the cost of using each payment method in Shopify.
What are other reports similar to the Sales by Payment Method Report?
To discover the financial performance of store you may also use other sales reports:
- Sales by POS Location Report
- Sales by Product Vendor
- Sales by Discount
- Sales by Customer Tags
Does the report include transaction fees for each payment method?
Mipler's Shopify payment fees report may contain transaction fee data, but only if it is available in the Shopify store admin.
