Imagine realizing that nearly half of your store's revenue comes from one city, but you've been stocking products evenly across the country. Missed opportunities like this are common when city-level sales data is overlooked. The Shopify Sales by City report gives you a crystal-clear view of where your customers actually shop, so you can focus marketing, adjust inventory, and boost sales where it matters most. With Mipler's Shopify Reports app, creating and analyzing these detailed city reports is automated and easy, no spreadsheets required.
Why the Shopify Sales by City Report is Important
City-level sales data goes beyond simple totals: it reveals the hidden patterns driving revenue. For example, a retailer we worked with discovered that 40% of their orders came from New York City, while several other major cities lagged far behind. By reallocating stock and launching a targeted local promotion in NYC, they increased sales from that city by 10% within a month.
Beyond top-line numbers, city reports help uncover insights such as:
- Local demand spikes: Identify cities with sudden increases in orders before competitors notice.
- Seasonal trends: Certain products may sell earlier or later in specific cities. e.g., coastal cities buying summer apparel weeks before inland regions.
- Marketing effectiveness: Measure which cities respond best to ads on different channels (Meta, Google, TikTok, email).
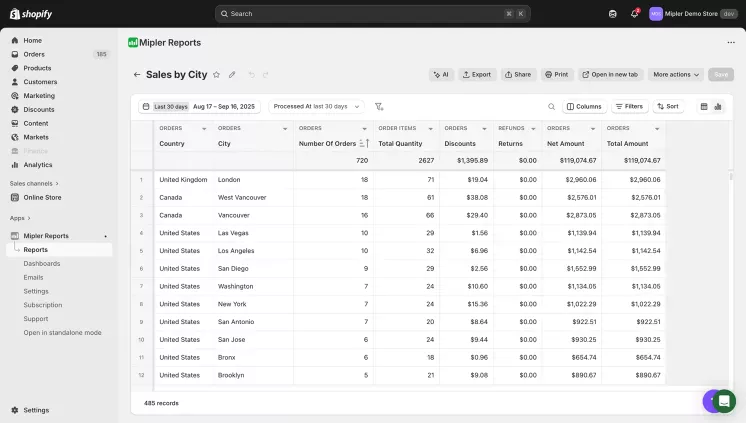
With this granular view, you can tailor marketing campaigns, optimize inventory, and improve fulfillment in a way that maximizes revenue, all while keeping an eye on emerging hotspots. Screenshots from Mipler's reports (see below) show exactly how city-level insights translate into action.
Shopify Sales by City Reports – what's available with Mipler
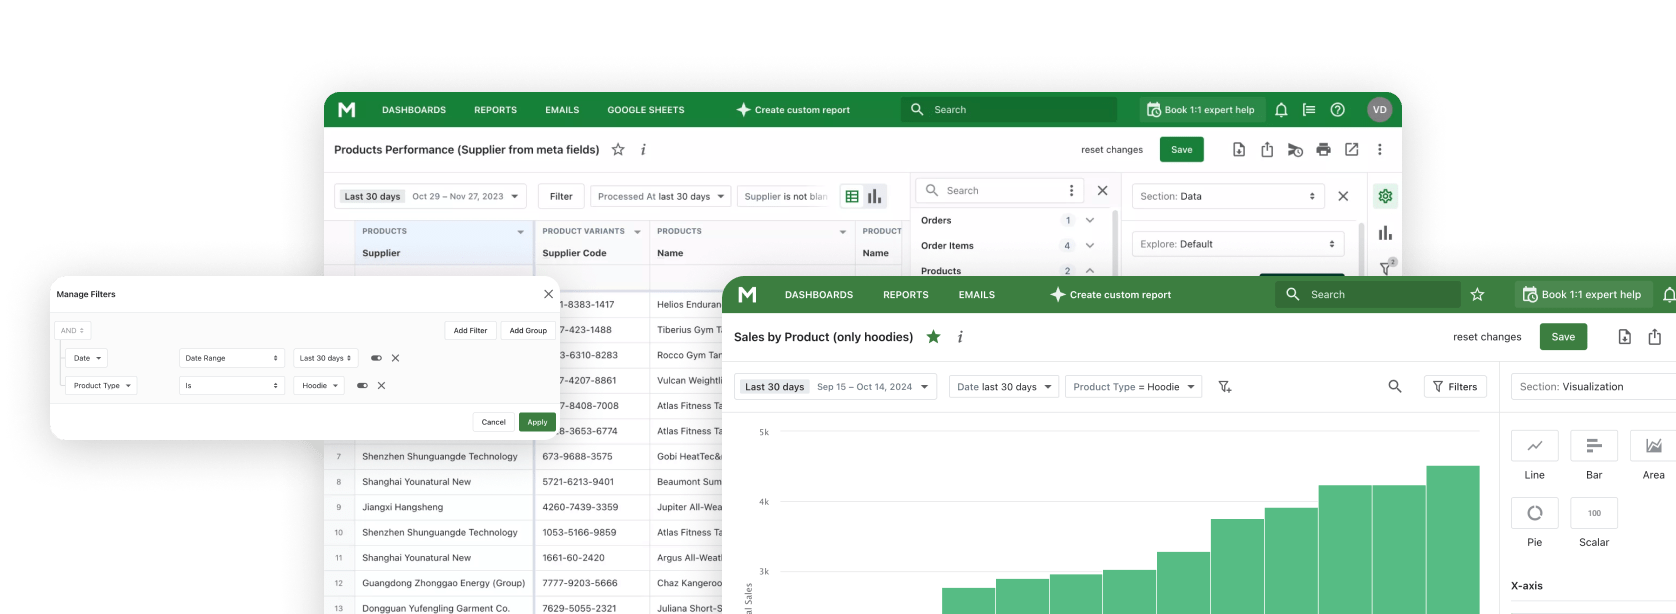
Mipler's reports library includes a Sales by City report, which you can fully customize with extra columns, filters, and grouping. It lists each city alongside its order count and sales amount. For example, one retailer saw that 45% of July's orders came from New York City (versus 15% from Chicago). By sending more stock to NYC, they achieved a 10% lift in sales from that city. All of this is done in a few clicks inside the app, no spreadsheets required.

Important
Local markets can change quickly. A city that was slow last year might heat up this year. Check the Sales by City report regularly (or schedule it) so you never miss a new trend.
Benefits of the Sales by City Report on Shopify
Precision marketing
Identify not only top-selling cities but fast-growing ones. Target ads before competitors do, and localize creative assets to match each city's demographics or buying culture.
Smarter inventory allocation
Combine city sales with warehouse data to predict where stockouts or overstock risks will occur. Shipping inventory closer to high-velocity cities can cut fulfillment costs and delivery time.
Geo-based product optimization
See which product types or variants overperform in specific cities — for example, premium items may sell best in coastal metros, while value bundles drive rural growth.
Trend forecasting
Monitor month-to-month shifts to detect new hotspots. Mipler's automation can flag when an emerging city starts contributing a higher-than-expected share of revenue.
Channel performance by location
Overlay marketing data to discover which acquisition channels (Meta, Google, TikTok, email) perform best per city — and reallocate spend accordingly.
With Mipler's Shopify Reports, you can go beyond static insights. Automate your city reports, cross-analyze them with product or campaign data, and turn local sales trends into nationwide growth strategies.
Automate Your Shopify Sales by City Report to Optimize Your Store
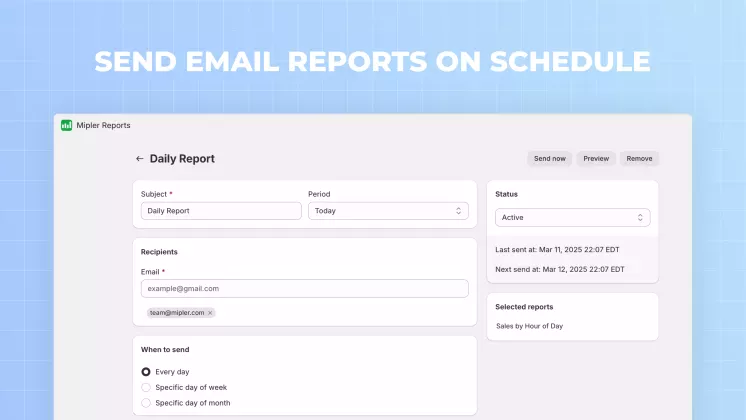
You can begin automating your Shopify Sales Reports when they are prepared. Mipler allows users to schedule the report to be sent daily, weekly, or monthly and decide whether to email or send it through Google Sheet. Having regular reports, the members of your team are always aware of the newest trends, as they receive a notification as soon as a new product combination gains popularity.

FAQ
What is the Shopify Order Items Report?
It lists each city with order count and revenue, showing which cities drive your Shopify sales. You can see each city's contribution (including percentage) at a glance.
How often should I generate this report?
After installing Mipler, open it in Shopify, go to the GEO reports section and select "Sales by City." Pick your date range and filters, then run the report. Mipler will instantly generate the city breakdown.
Can I filter by specific cities or dates?
Yes. You can filter the report by city name, order count, or by date range. For example, restrict the report to the last quarter or to your top 5 cities to focus the analysis.
Why use a Sales by City report instead of only by country?
City-level data pinpoints exactly where demand is highest. A country report might show the US as a top market, but the city report tells you if NYC, LA, or another city is the real driver. This lets you fine-tune local strategy.
