How Reporting is Done in Shopify
Analytics to Boost Sales and Revenue
There are several ways a store can depict the statistics available in its Shopify database. These summary papers can be divided into general and specific, which include specifics.
In the admin panel, a manager can access reporting functionality based on classes presented in the embedded Shopify reports app. Each of the aforementioned sections is established according to the type of the result being depicted. For example, the summary paper "Sales Over Time" serves as a tool for understanding how sales are going in the general picture.
The rundown of accessible statistics depiction tools is widespread for any store, but the specific reports that can be utilized by a storekeeper rely upon the membership plan enabled in the company.
| Types of Shopify Reports | Shopify Lite | Basic Shopify | Shopify | Advanced Shopify | Shopify Plus |
|---|---|---|---|---|---|
| Finances | ✓ | ✓ | ✓ | ✓ | ✓ |
| Products | ✓ | ✓ | ✓ | ✓ | ✓ |
| Live View | - | ✓ | ✓ | ✓ | ✓ |
| Acquisition | - | ✓ | ✓ | ✓ | ✓ |
| Inventory | - | ✓ | ✓ | ✓ | ✓ |
| Behavior | - | ✓ | ✓ | ✓ | ✓ |
| Marketing | - | ✓ | ✓ | ✓ | ✓ |
| Order | - | - | ✓ | ✓ | ✓ |
| Sales | - | - | ✓ | ✓ | ✓ |
| Retail Sales | - | - | ✓ | ✓ | ✓ |
| Profits | - | - | ✓ | ✓ | ✓ |
| Customers | - | - | ✓ | ✓ | ✓ |
| Custom Reports | - | - | - | ✓ | ✓ |
Some reports like Profit, Cohort Analysis, and advanced customer segmentation are only unlocked in Advanced and Plus plans. Shopify Basic and regular Shopify (Grow) have improved reporting since 2024, but still lack deep customizations without an add-on.
Types of Shopify Reports
Shopify Reports on Finances
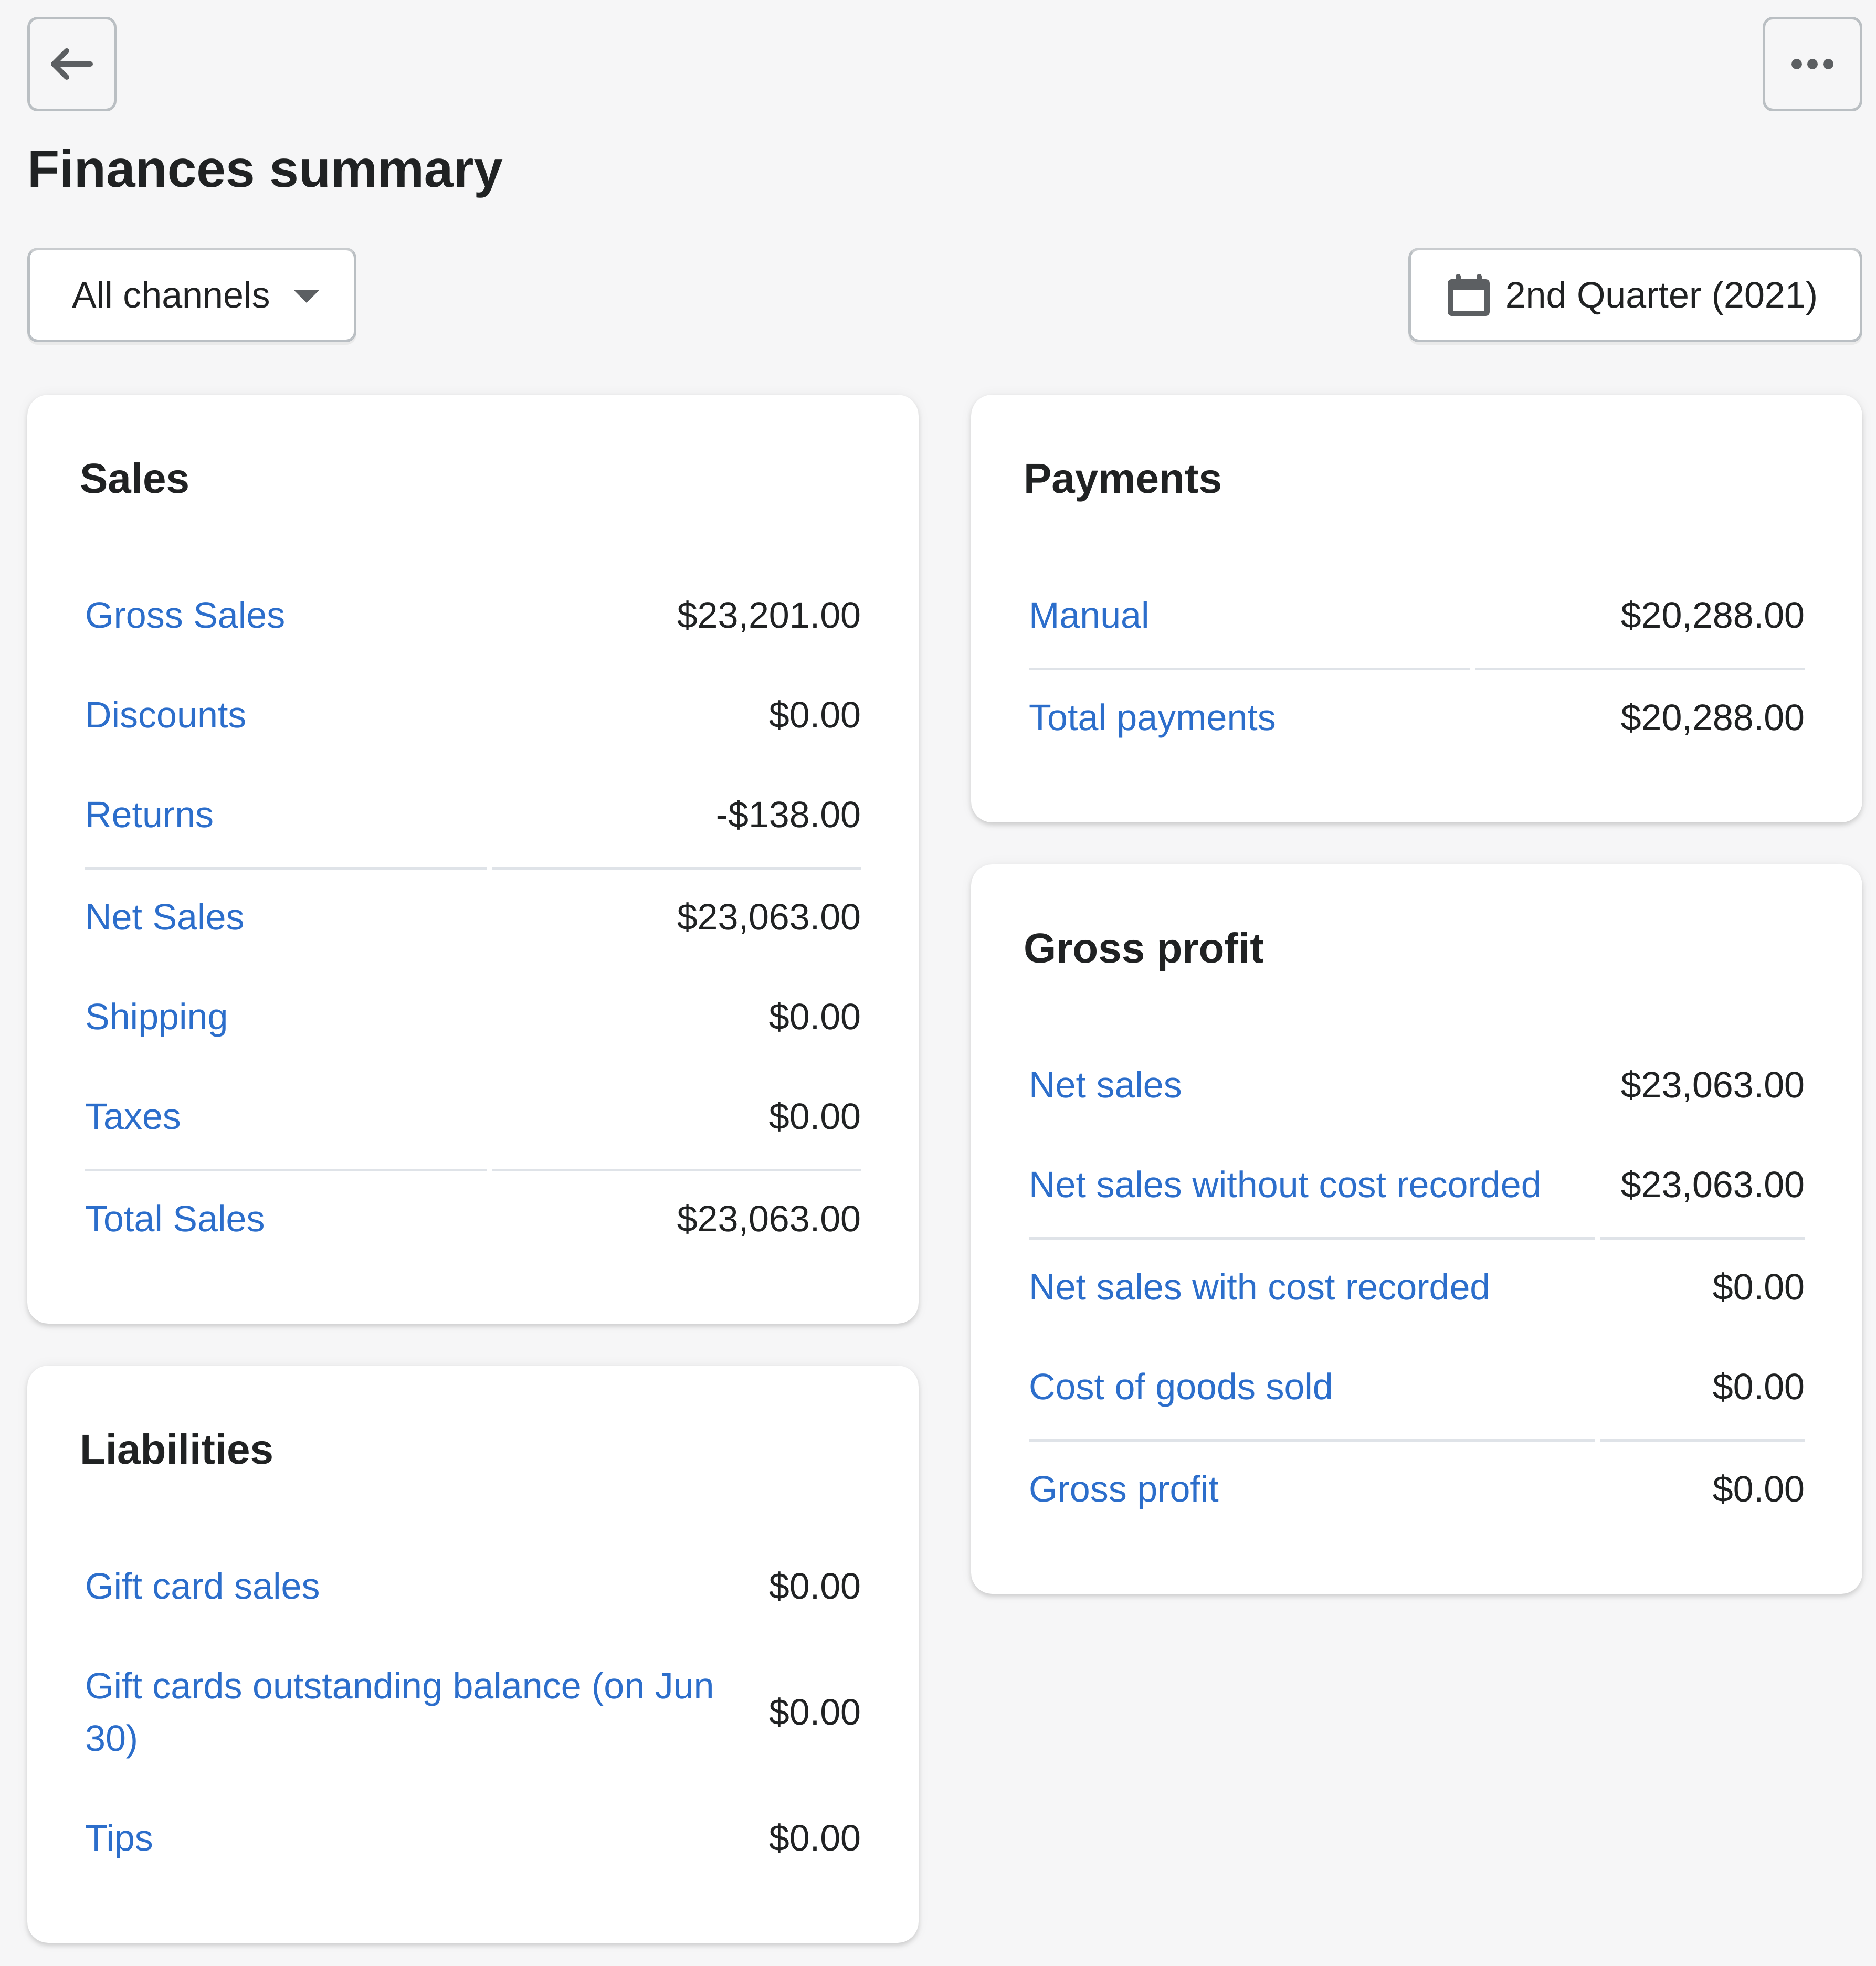
The segment of the summarization page devoted to finances provides a depiction of several key values of the store operation. Additionally, this section contains links to the total summary depiction and gives statistics on store cash.
A storekeeper can obtain this type of view by opening his managing interface, from where he should navigate to Analytics. On this page, the Reports link will be available. Choose a preferred financial report, for example, the Finances summary.
You can select a sales channel and set the time range to depict in the report. Removed channels won't appear in the list of channels; however, the historical data can be viewed for them.
Shopify recently added better profit margin breakdowns, allowing managers to analyze not just total profit, but profit by product, collection, or sales channel. This is especially useful for understanding which parts of the business are most profitable.
Shopify Reports on Products
Product analytics in Shopify is available after navigation to Products > All products. Select the product you need to get the data on, and on its page, locate the Insights tab. Click the View Details option to see the sales statistics on the particular product.
For each product, Shopify is capable of showing the net sales, sales breakdown, net sales by channel, net units sold by traffic source, and customers. The latter Shopify report shows the ratio of first to existing shoppers.
The product insights now also include "Product Subscriptions" data (if enabled) and profitability metrics for each product. These additions help store owners decide which items deserve more marketing or inventory investment.
Reports on Acquisitions
Starting from the Basic Shopify plan, a store owner can track acquisitions of new visitors. This reporting section includes statistics on sessions over time, by the referrer, by location.
Do not confuse procurement statistics with the Sales by traffic referrer source. The former does not show converted sales or the number of purchases. This page simply displays the numerical value of how many people there were.
Acquisition reports now integrate more seamlessly with Shopify Marketing, making it easier to connect ad spend with traffic sources.
Inventory Statistics
Currently, this system provides a way to get clues on a month-end inventory snapshot and track the amount of inventory sold per day. Such information is available through inventory reports, which can be found in the Analytics > Reports > Inventory section.
Inventory reports are not updated immediately when requested. It may take 12-72 hours to renew the gathered statistical data.
Shopify recently improved inventory reports by adding daily sell-through rate and aging stock analysis. This helps managers avoid overstocking or running out during seasonal spikes.
Behavior Reports
The reports on behavior bring insights about how to better market products, enhance upsell to the target audience, create promotional deals (discounts, product bundles), and increase the average order total.
Navigate to the Analytics section of the panel. Here find an option marked as Reports. It will give access to Behavior. From here one can find tips on the visitor presence details. Most of them can be used by starting the simplest subscription option available. However, the Online store cart analysis report is available for stores on Shopify or higher plans.
The "Cohort Analysis" report is now available on Advanced and Plus plans. It shows how groups of customers (by signup date or first purchase) behave over time, which helps in planning retention campaigns.
Reports on Marketing
Such type of reports allows a store owner to get information on the efficacy of marketing efforts in his store. He can also obtain a Shopify conversion rate report.
Information from these reports may be key to understanding the reasons that attract shoppers to the store and persuade them to make purchases.
The marketing reports now include attribution insights, showing which channels contribute most to conversions across multiple touchpoints.
Live View Shopify Report
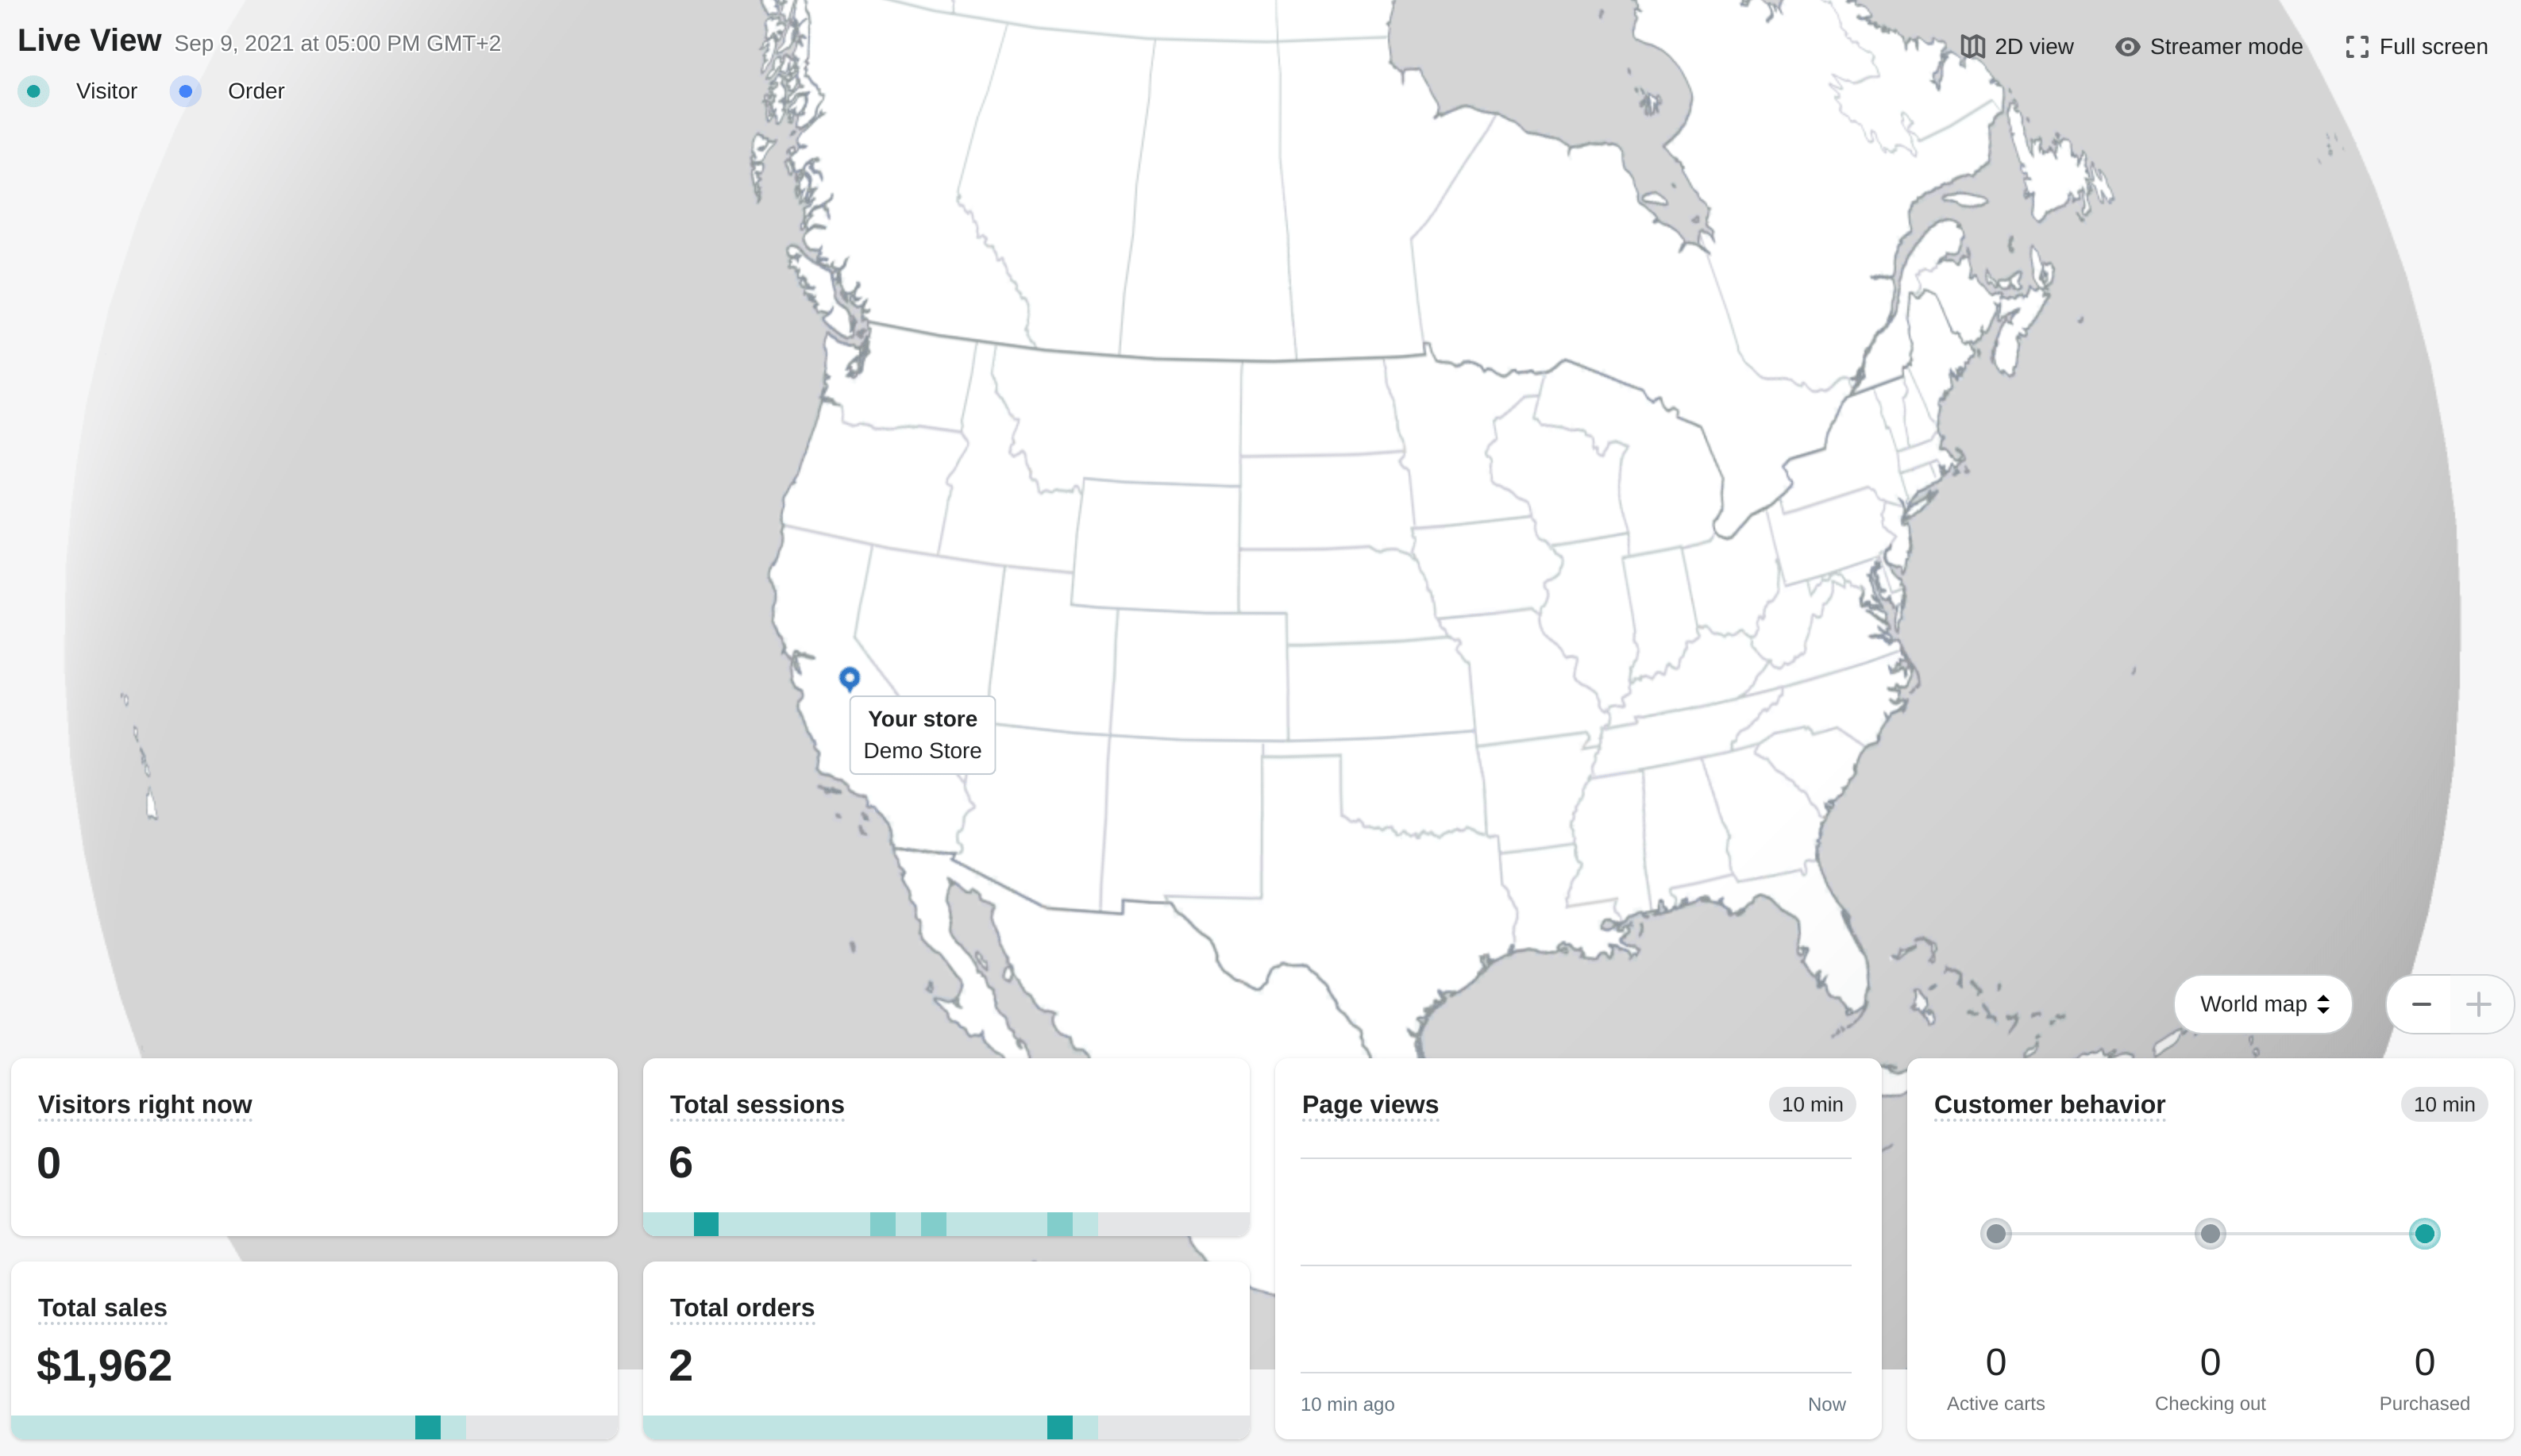
An online shop owner can almost see what is happening in his store in real-time with the Live View report. The data is depicted on the virtual world map or globe, depending on the visual style preference. Navigate to Analytics > Live View to get this report.
Live View functionality is especially useful during periods of high in-store traffic. Those events can occur, for example, on days of sales, like Black Friday, or Cyber Monday.
The Live View report allows monitoring the in-store activity from all channels and can be used to get a picture of the immediate results of marketing efforts, like discounts and other marketing promotions.
Shopify improved Live View performance during peak events like Black Friday, ensuring near real-time accuracy.
A Streamer mode option allows sharing the Live View Shopify report. During such streaming, the store metrics are blurred.
Reports on Orders
To see Shopify order reports that bring data on order volume, order fulfillment, shipping, delivery, and returns, navigate to Analytics > Reports > Orders section.
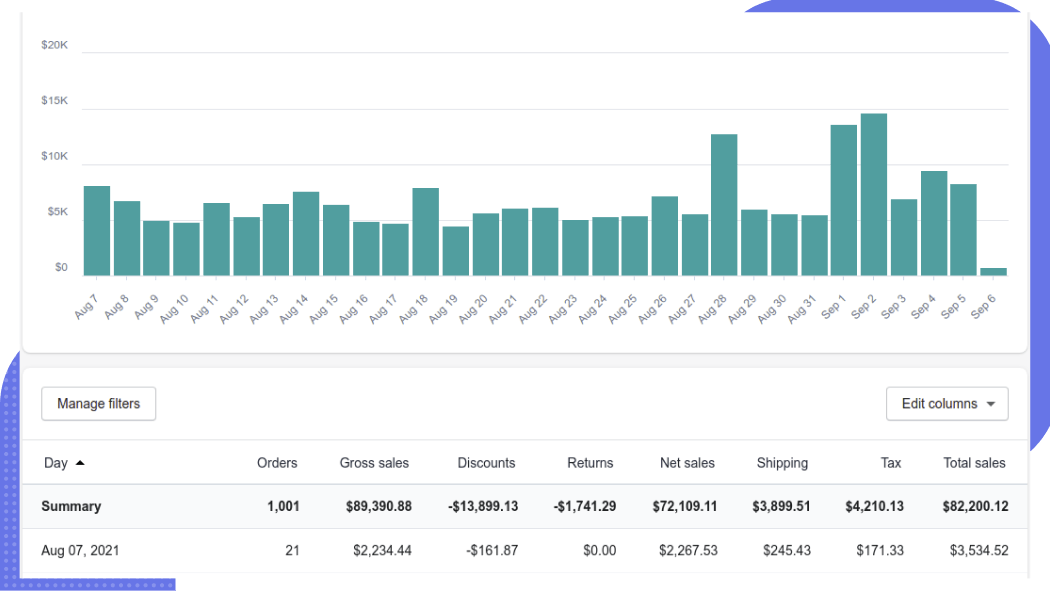
For example, the Orders over time report displays a total number of orders over the specified time period.
Shopify Reports on Sales
See data on orders as sales over time, by product, or by channel with sales reports. To get these reports, navigate to Analytics > Reports > Sales section. Here click Show all button to get all reports.
The Sales report for point of sale (POS) can be obtained in the Retail sales report section.
Retail Sales Report
Get the information on sales for each POS of your store. Navigate to Analytics > Reports > Retail sales to build such reports.
For stores on the Shopify plan, the platform provides reports on retail sales by product, by product variant SKU, by the product vendor, by product type, by Point of Sale location, by staff at the register, by staff at the register (daily), by staff who helped with the sale.
Reports on Profits
To view Shopify's profit report, first check if the company is on the correct plan. It should be on Shopify or higher. Then navigate to the Analytics page. Locate on this page a link to the Reports button. When the latter loads on a screen, find a Profit margin section.
Profit is depicted in reports for products and variants that had costs recorded at the moment of sale.
Profit reports now integrate with COGS data more accurately, especially for stores using multiple fulfillment locations. The new "Profit by Product" view is particularly useful for identifying best-margin items.
Customer reports
Several plans, such as Shopify, open new types of statistics depiction a person responsible can use to present. Another one with similar functionality is Advanced Shopify. Identical results can be obtained with Shopify Plus. All of them bring admittance to a detailed view of customers. Customer statistic shows average order coun. A store manager can equally see the average order totals. He becomes capable to know the expected purchase value.
Additionally this section brings visualization of customers over time. The store managers can also activate the sales view on first-time vs returning customers. The geographical distribution of shoppers can be uncovered. Storekeepers can also get to view the returning and one-time shoppers.
These customer reports have a limit on a maximal number of 250,000 represented clients. All gained statistics are updated usually every 12 hours.
Shopify recently added retention metrics and customer lifetime value estimates into this section (for Advanced and Plus). These new reports allow stores to focus on long-term customer health, not just one-time orders.
Custom statistics display
The admin or owner can see exactly the details he wants in the report by generating a custom statistics release. Navigate to Analytics > Reports > Create a custom report.
While custom reports were traditionally only available on Advanced and Plus, Shopify has started rolling out limited customization (filters & dimensions) to regular Shopify plans in late 2024.
Use filters to exclude the data that is irrelevant for the particular custom report. Alternatively, edit an existing report
Advanced Reports for Shopify
Smarter Dashboard

Since last update, Shopify has rolled out a faster, customizable analytics dashboard. Merchants can choose which metrics to display (sales, conversion, top products), resize "metric cards," and save personalized dashboards. Key data updates in real time, so you can spot trends instantly.
Flexible Reporting and Data Exploration

Shopify's 2025 update makes reporting highly flexible. Merchants can fully customize reports by combining metrics like sales, sessions, and conversion rates, switching chart types, and adjusting date ranges. Useful views can be saved as custom reports, making it easy to track campaigns such as holiday promotions in one place.
For deeper exploration, Shopify lets you build reports from scratch or use Shopify Reports, a query language that provides instant answers to specific questions, with drag-and-drop tools and real-time queries, merchants gain actionable insights without coding.
New Reports & Metrics

- Live View – real-time dashboard that auto-refreshes key top-line stats (orders, sales, sessions, etc.) as they happen
- Benchmarks – compare conversion rates, AOV, and sales against similar stores.
- Customer Cohorts – groups customers by the date of their first purchase to show retention and repeat-buying behavior.
- Availability - merchants can view dashboards, run queries, and track campaigns from anywhere from now, using mobile phone
Overall, Shopify's 2025 analytics enhancements give merchants increased insight and usability. The real-time, fully customizable reports and mobile access mean you can discover critical trends faster than ever. By leveraging new tools like cohort analysis and benchmarks, store owners can make smarter, data-driven decisions – from planning inventory around top-selling items to refining marketing spend by seeing what actually drives conversions. In a word, Shopify Analytics is now more powerful, flexible, and merchant-friendly than ever.
Get more insights with your store data
A storekeeper gets the ability significantly enhance the representation of the statistics with a third-party reporting app. It will bring new reports by analyzing data available beyond standard Shopify reports. Additionally, it will rebuild standard reports to make them more informative and useful.
After installing this app shop owners gets 50+ reports with an easy-to-use and intuitive interface enabling efficient management of all the reports. The usage convenience is guaranteed with several common user-friendly features like drag & drop, filtering, and sorting.
Pricing
Shopify Advanced Reports app is suitable for any Shopify store. It proposes several plans for shops with various sizes and requirements in analytics.
Small online endeavors that have up to 1000 orders monthly can use the app without any expenses. The Free plan is also suitable for app evaluation if the 14-day free trial period was not enough.
Advanced Reports makes any report available
Basic summarization system makes some reports available only for certain plans. This may lead to missed opportunities due to a fact that a store owner was not able to obtain valuable insights with the report that is blocked for the plan his business is currently on.
Using this app designed by Mipler for a store on this platform its owner gets the ability to analyze any data available in your store. This app doesn't segregate available reports by subscription plans.
The only exception is the Free plan, which proposes all standard reports, but there is no possibility to build custom reports. The ability to create custom reports and use filters is included by starting the Basic plan and above.
Advanced sales reporting
While standard Shopify reporting includes 10 variants of how sales can be represented, with Advanced Reports by Mipler the business becomes capable of presenting 19 reports.
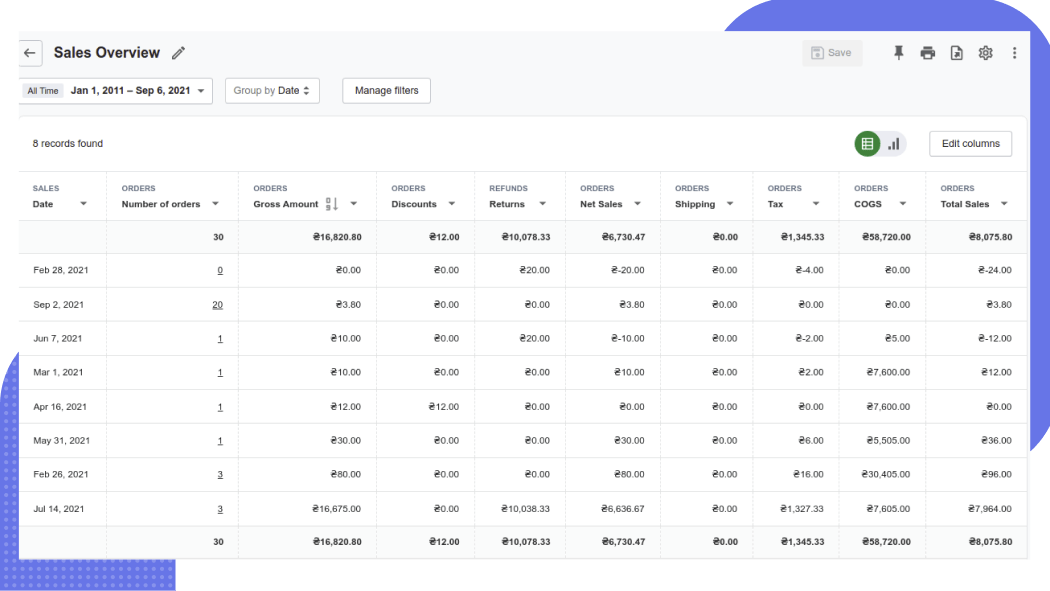
Look at the main sales statistics on one page. A storekeeper is presented with dozens of summary papers, which can be inconvenient To quickly track the business performance, getting clues on deals in one glance is essential.
The metrics of your shop are shown in numeric and graphic formats where it is applicable.
For example, a day is the standard summary for depicting sales values in the Mipler app. A responsible person can also use grouping by week, month, or year.
The online summary paper represents the whole amount of values taken within the dataset of orders for a certain period. One set can be, for example, a Net Amount. The other one can be referred to as Taxes. A person responsible is free to choose Shipping statistics or Discounts.
More accurate Shopify Reports such as Sales by Product or Sales by Variant, Sales by Product Variant SKU, and Sales by Product Vendor allow us to get a much deeper dive into sales not by order, but by-products or manufacturers which were selected.
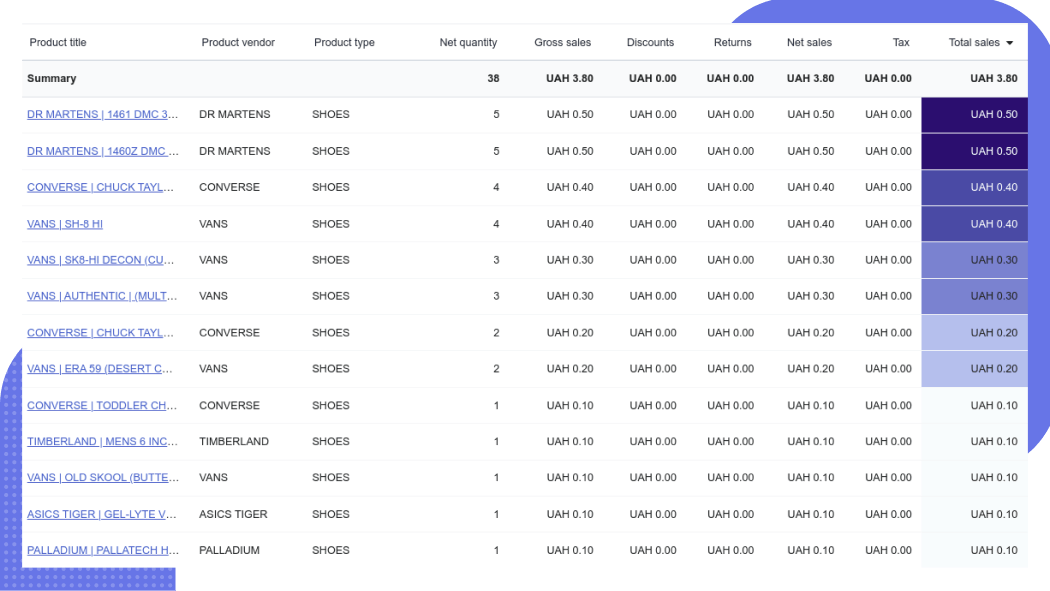
Thus, using sorting by the number of sales, you can find both products that are selling very well and products that have little or no sales.
The task of inventory refill cannot be imagined without this information in case when purchasing new products should be done optimally. Such insights are also helpful in deciding in case of a sale. Use it to rearrange items with low sales to free up money and buy highly liquid goods.
This external application offers various filters that can be added within the Sales Overview to further enhance understanding of the whole picture that happens in sales. For example, using this tool the statistics can be filtered geographically or by promotion coupons.
Additionally, the data that is formed using the statistics outline can be presented in a more visually enhanced form of a graph.
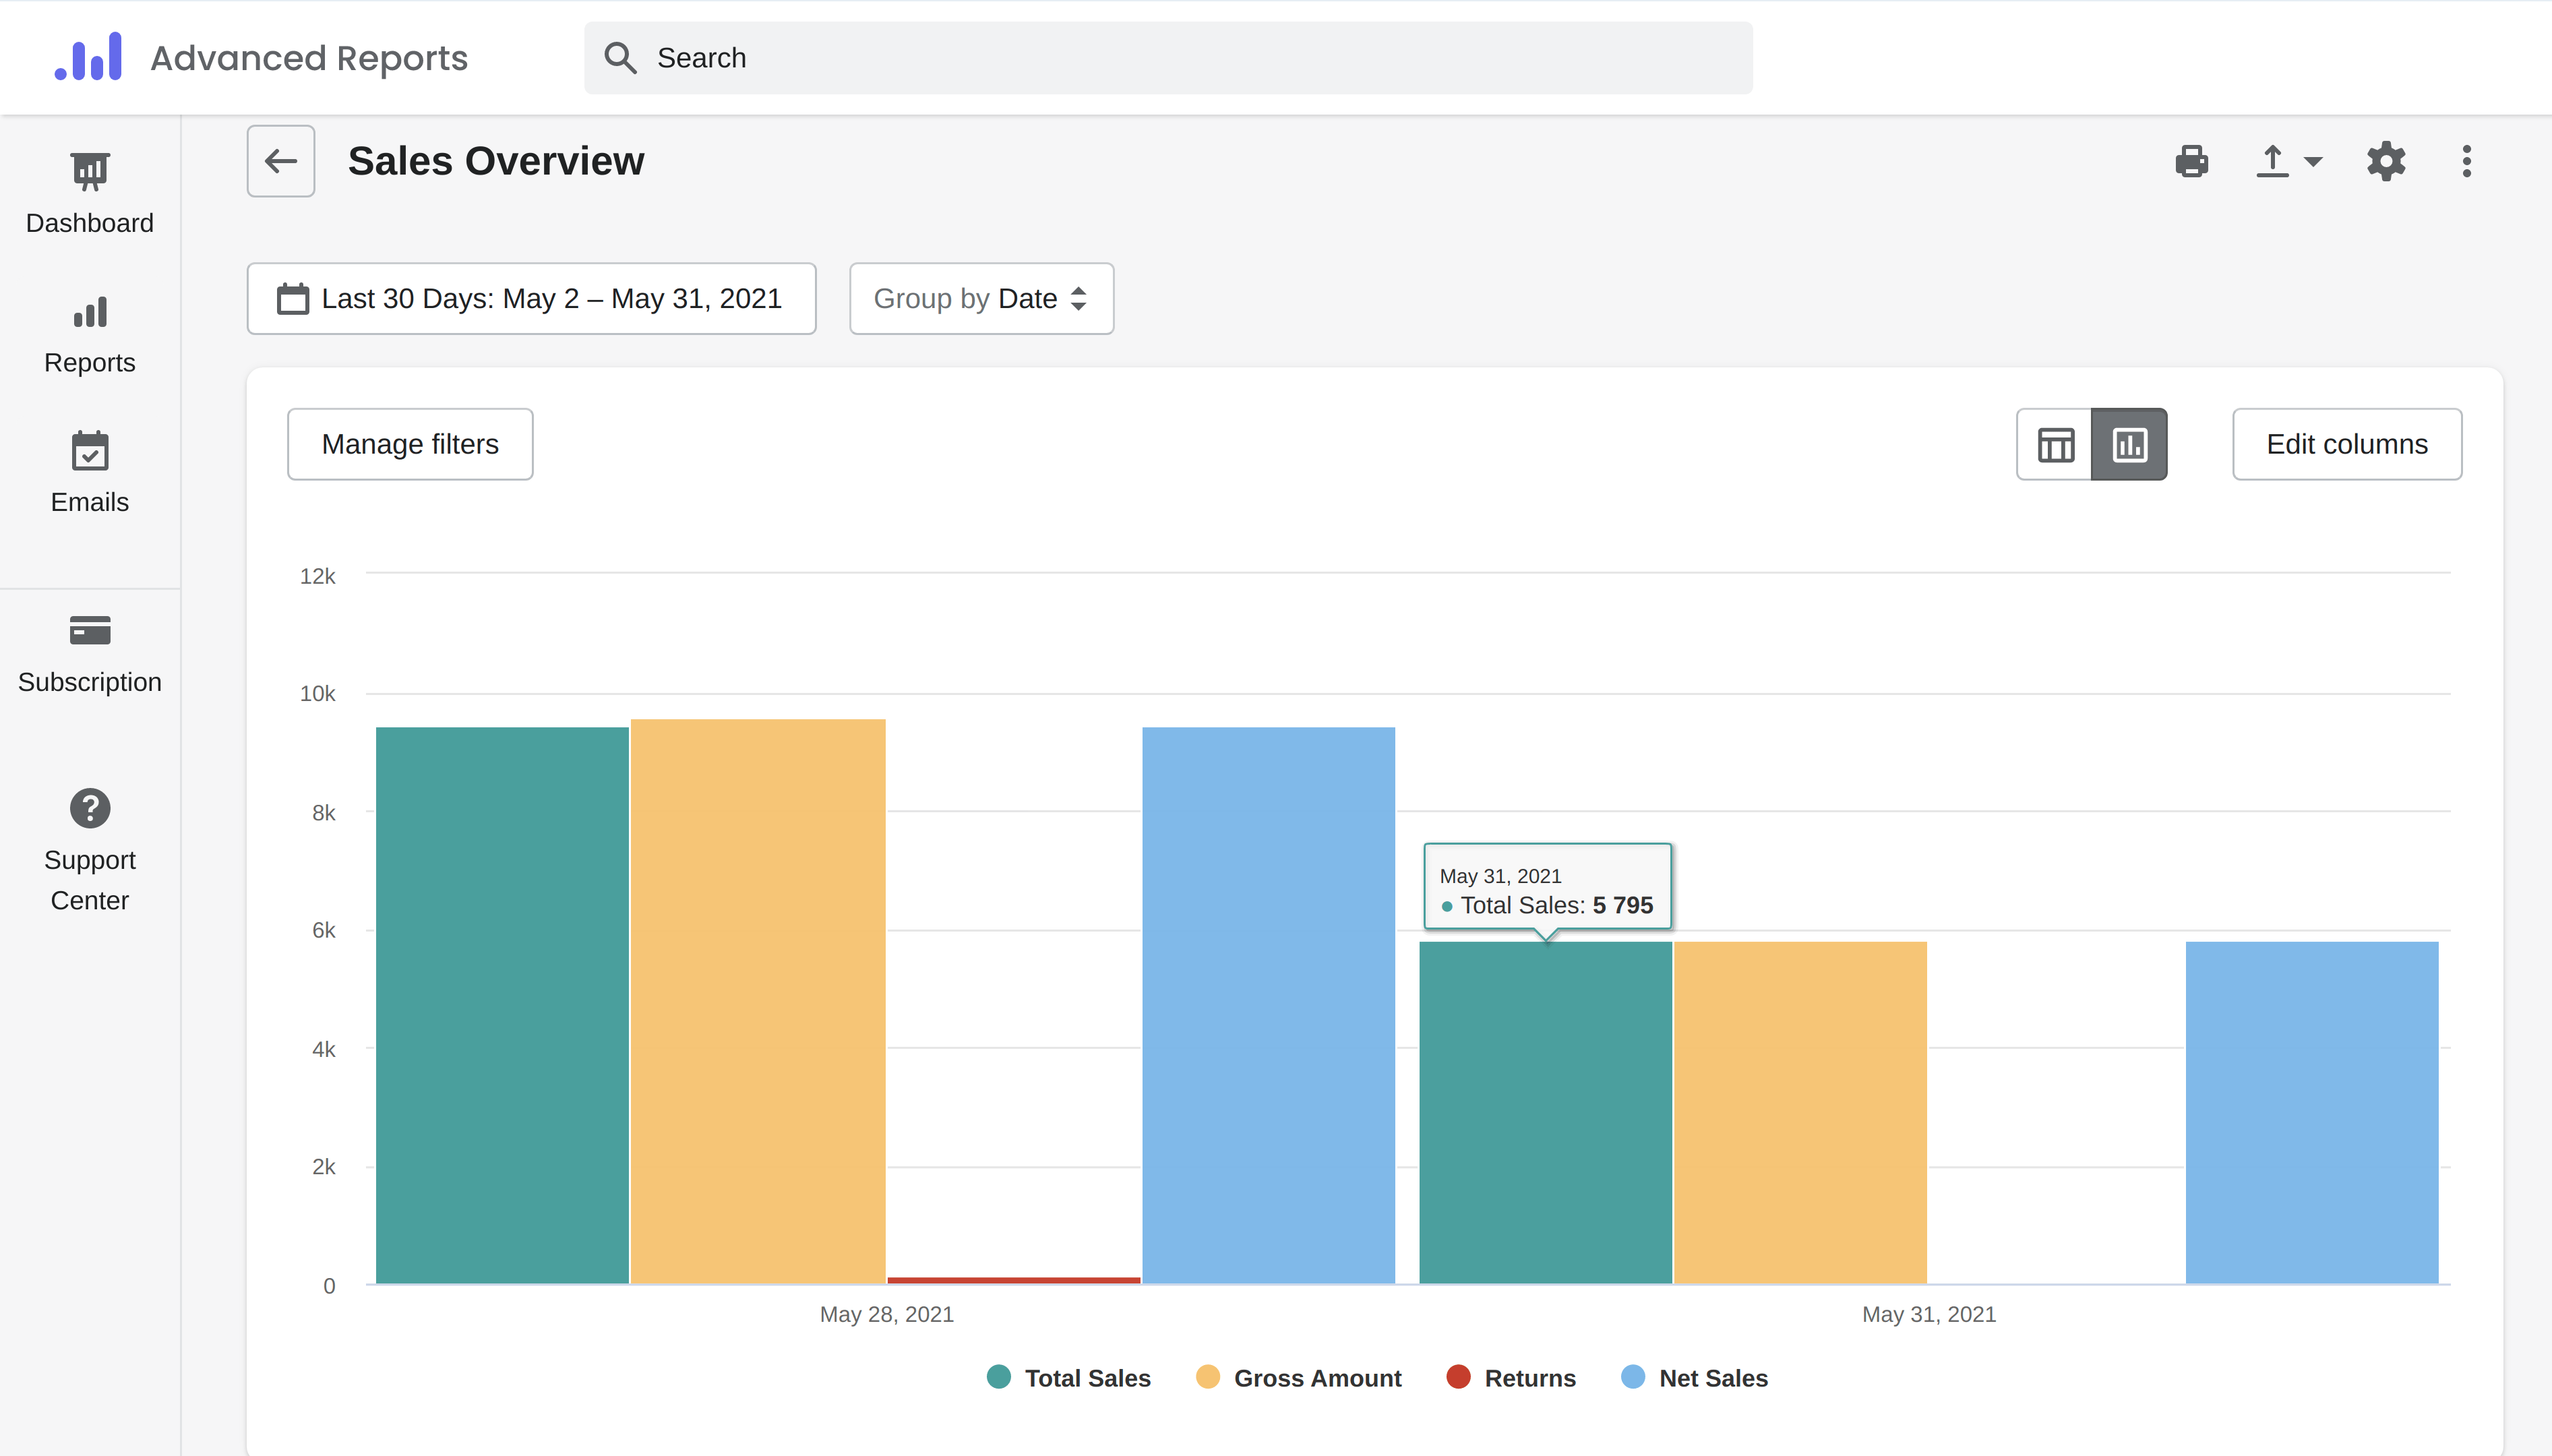
Dashboard of this app by Mipler helps to see all gathered data the database holds on sales. The manager can conveniently display it for some time scope he needs to oversee. It then can be used for confronting it with any figures gathered on sales at another scope of view that is typically presented as a time range. A storekeeper has the ability to set the period from the predefined set of timely terms. A manager can use today or yesterday. Alternatively, he can select a week. Still, he has the ability to depict the data within a month. The system also approves statistics in quarter time periods. For some managers, it may be more convenient to get the values for a year period.
Custom reports
A significant advantage of using the Mipler module in daily activity is the ability to generate custom statistics depiction starting from the Basic subscription plan. The performance of the summarization a store manager obtains with default tools gives a glimpse of the data only for stores that utilize top subscription plans. The latter is in accordance with the official guideline, referred to by the name of Advanced Shopify. Another one included in this specific list is Shopify Plus.
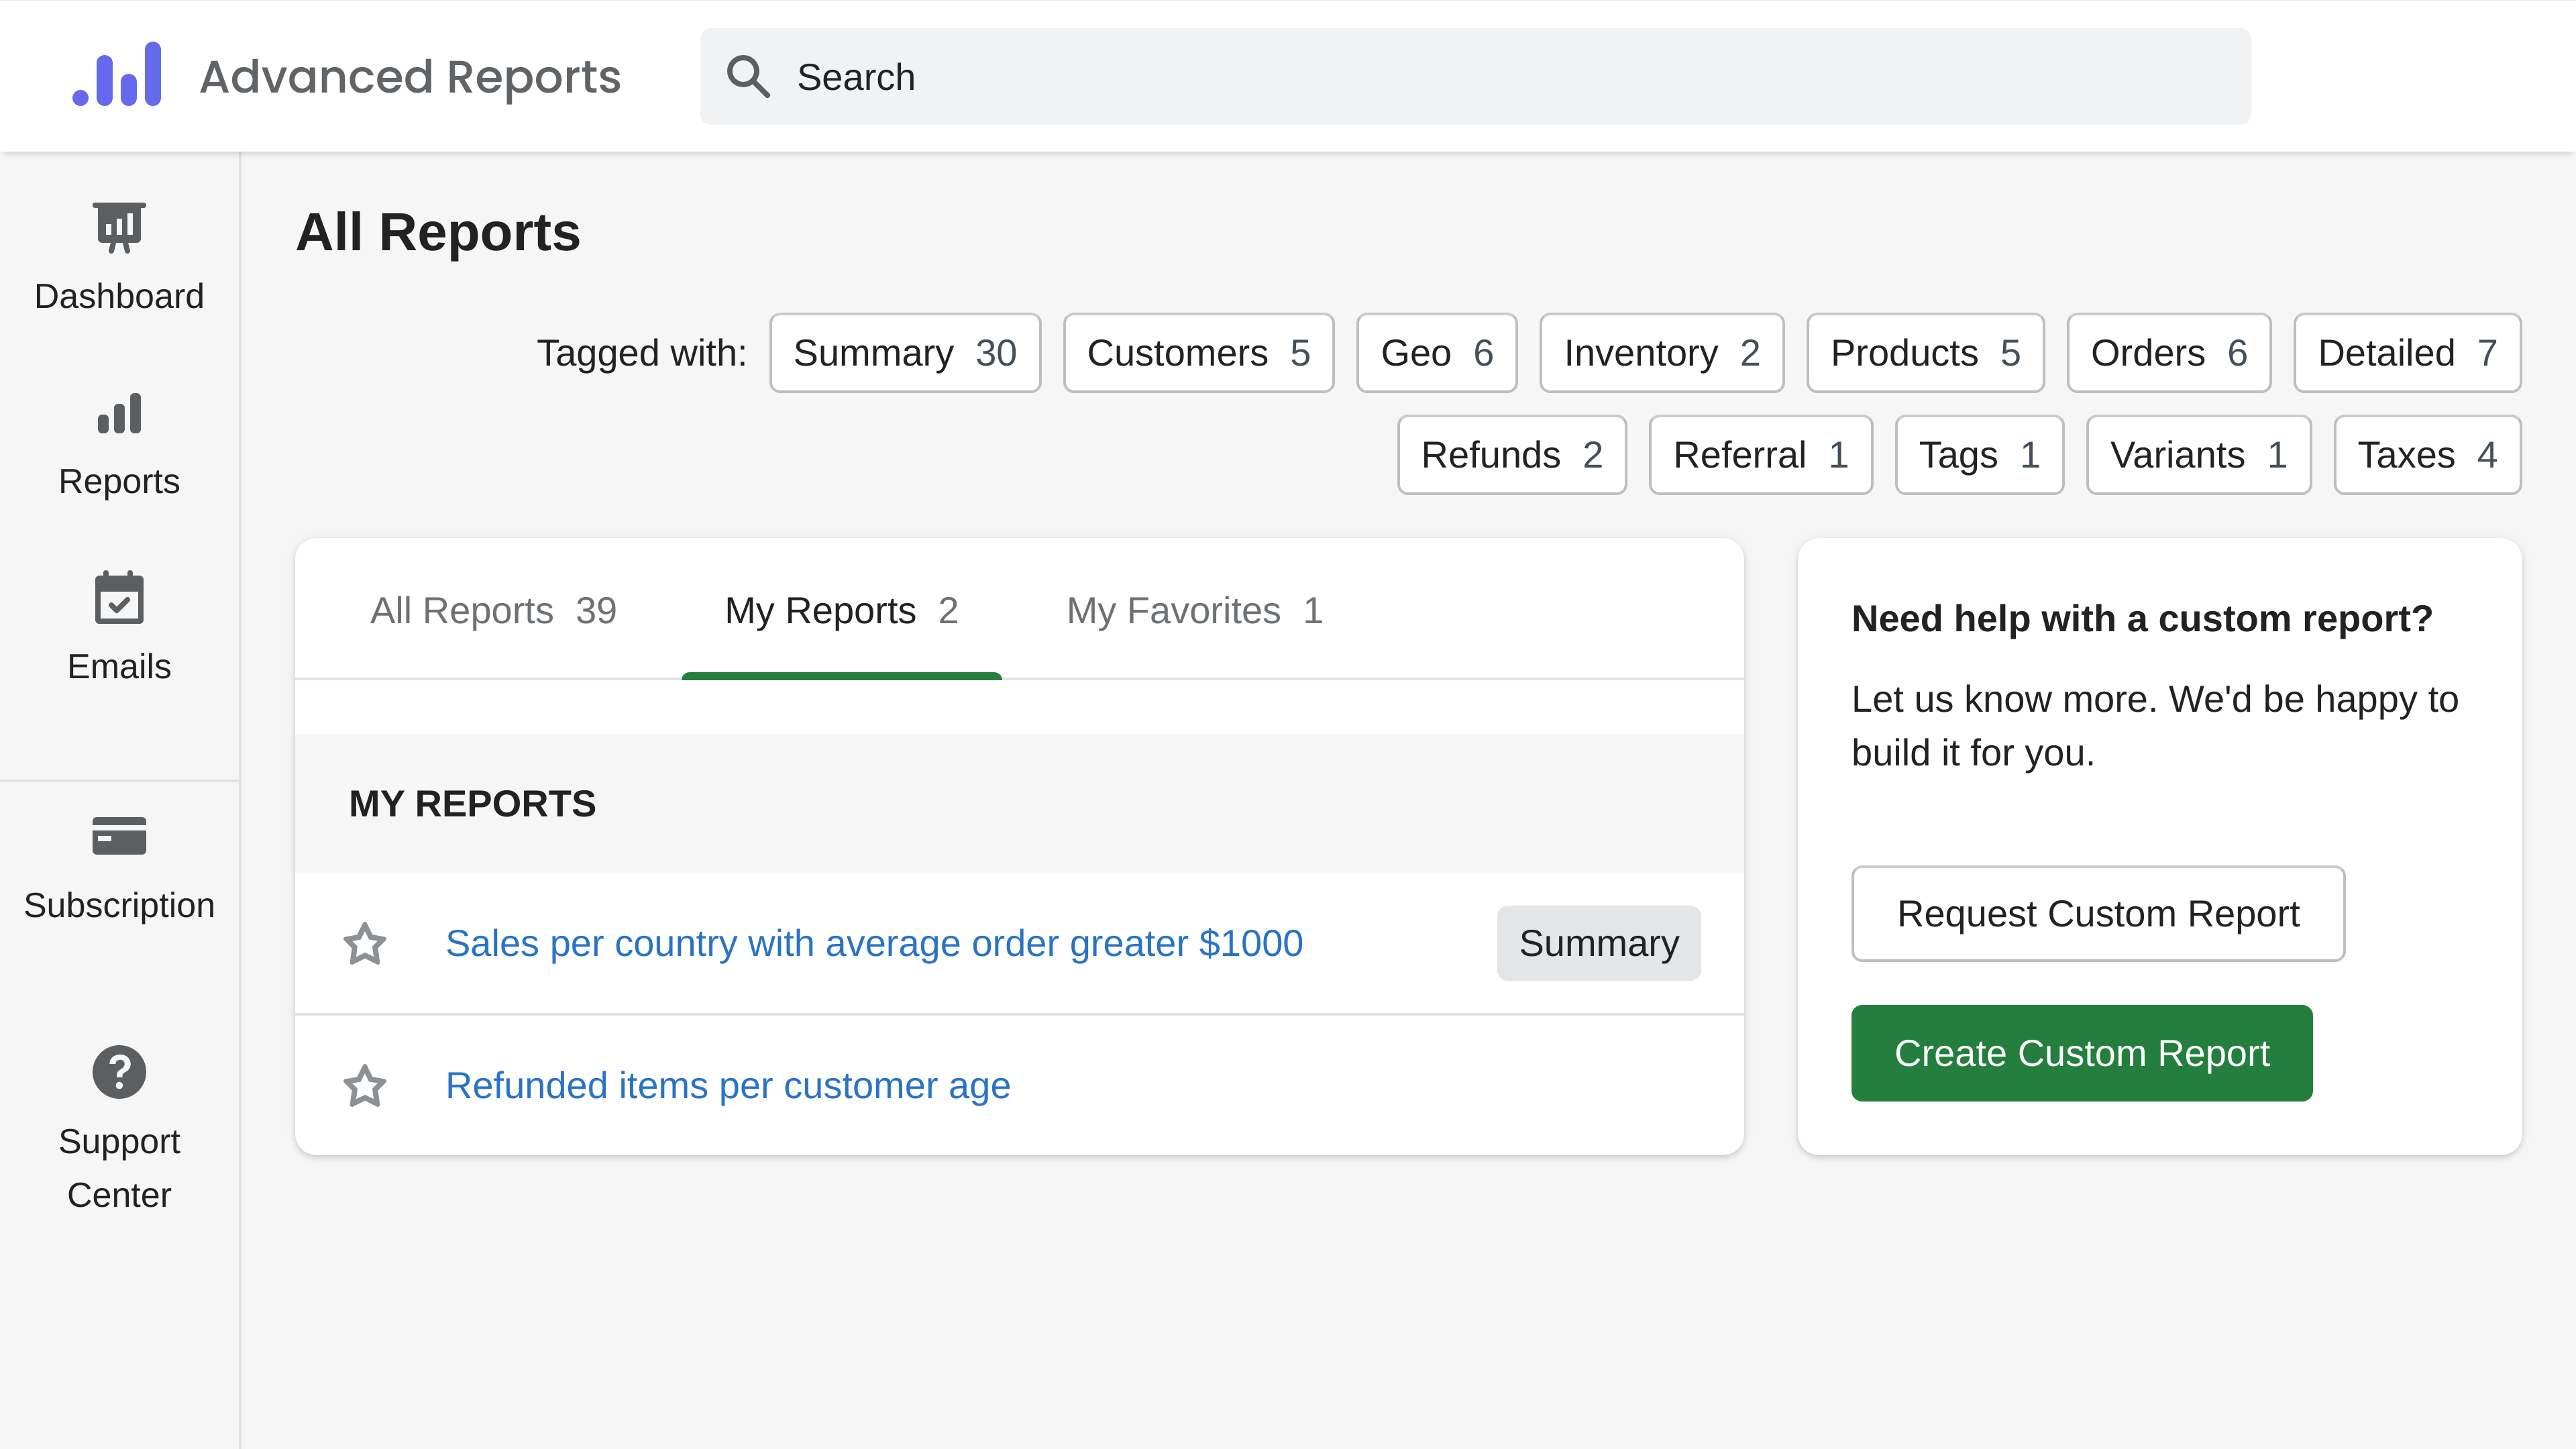
Having the ability to make custom depictions of the statistics a store owner can get insights from any numbers that are present in the business database. Additionally, a summarization tool by Mipler for the online site can visualize this data in a most suitable format. You can select a table, chart, or single value.
Even though Shopify native reports are stronger now, apps like Mipler are still more flexible. Mipler lets you build unlimited custom reports, use advanced filters, and automate exports, features that native Shopify reports only partially cover.
