It is important to understand how your store develops in the changing environment. Sales of goods most accurately show whether the store manages to interest customers in its products. Sales reports collect all the results in one document. Using them, you can monitor the operation of your store.
This article was created to get to know the functionality of Shopify sales reports. You will learn about their importance and why there are so many different types. Let's talk in more detail about the report, with which you should start familiarizing yourself with the sales of your store.
What are Shopify Sales Reports?
Sales reports are common for analytics and operational activity. With their help, you can analyze your store's sales for certain periods from different points of view (by collections, customers, products, and so on).
Shopify total sales reports reflect the productivity of your store. On the other hand, sales can be viewed as the intensity of movement of goods between the seller and the buyer. Therefore, the reports are also used to control the operational activities of the store.
Mipler was able to complement Shopify Reports. Various sales reports show both general information on sales, as in the Shopify Sales Overview Report, and data for each type of product, as in the Sales by Variant Report. You can also discover:
- the total amount of sales of goods;
- what sales tax you pay;
- how much is delivery;
- the number of returned orders;
- discounts.
Why are Shopify Sales Reports Important?
The main indicator of the store’s success is its income level. Sales reports combine all necessary information in one document. In addition to total sales, each report also includes other indicators:
- Number of orders
- Date of sales
- Gross sales volume
- Total sales volume
- Taxes
- Discounts
- Returns
Having this data, the store can assess the impact of additional parameters on the sales result. If you have a large number of returned orders, you will immediately see that the difference between gross sales and total sales is very large.
The dynamics of the store's development can be assessed only over a certain period. In reports with less detailed information, you can see the change in the main sales indicators for the day/month/year. In this way, you can compare the indicators that are important to you for different periods of time, for example, the beginning of the year with the middle.
You can analyze other important information using sales reports:
- The purchasing behavior of customers is immediately visible by the number of orders on a certain day.
- The number of returned orders shows the level of satisfaction of your customers.
- The amount of discounts makes it clear how effective the store's sales strategy is.
- The revenue trend can be seen from the Shopify store's total sales over time.
Most Common Types of Shopify Sales Reports
Sales reports are a large category of reports. The peculiarity is that they do not simply reflect how much your store sold. There are always some conditions, such as sales for a month, sales of products from a certain supplier, or sales of a specific product type.
It is important not just to say that you have earned such an amount. While this will definitely please you, it won't show the details. In addition to the general sales overview, sales are broken down by various characteristics to provide more information about the store's efficiency.
Shopify Sales Reports analyze sales information about:
Time:
General:
- Sales Overview Report
- Average Order Value Over Time
Product Classification:
- Sales by Variant Report
- Sales by Collection Report
- Sales by Product Type Report
- Sales by Product Tag Report
- Sales by Vendor Report
- Sales by Vendor > Product > Variant Report
Customer:
- Sales by Customer Report
- Sales by Customer Tags Report
Location:
- Sales by Country Report
- Sales by Province/State Report
- Sales by City Report
- Sales by POS Location Report
Other Reports:
- Sales by Discount Code Report
- Sales by Payment Method Report
- Sales by Channel Report
- Sales by Order Tag Report

Keystone of Success — Shopify Sales Overview Report
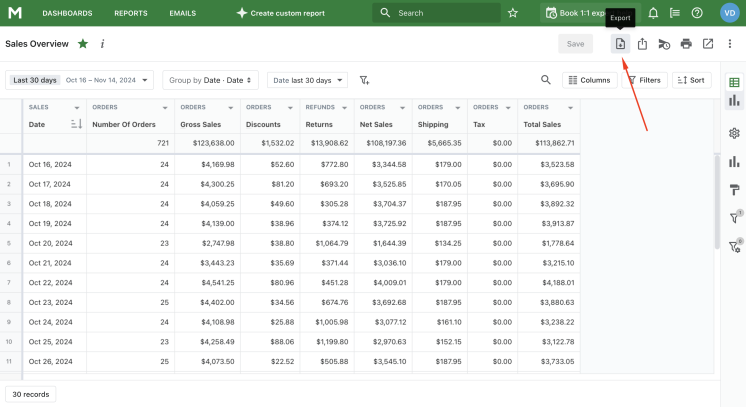
The Shopify Sales Overview Report provides a detailed description of your sales without breaking them down into different terms.
The document displays a list of orders processed in the store each day during the specified date range. Start your sales analysis with this Shopify total sales report. You can see how much was sold daily, how many were returned, total revenue, customer discounts, and shipping costs.
A general overview of sales results allows you to assess how your store works as if from above. You see the big picture and determine whether profits are growing or falling. So, the Shopify Sales Overview Report will help you determine which day/week/month/year sales were the best/worst.
What is a store without special sales days, for example, Black Friday, sale, or Halloween? Shopify Sales Overview will show how sales on special days change against the background of normal days. Having total sales, you can evaluate whether your marketing actions were effective.
The data displayed in Shopify Sales Overview Report can be used to answer questions such as:
- How many orders has the store processed each month over the last year?
- In which months were the gross, net, and total sales the best?
- How many orders have been returned in recent months?
- What was the monthly sales tax paid?
- How to view discounts received by customers and how much it costs to deliver goods?
- What is the monthly total number of orders and items purchased?
- What are the gross profit and gross margin each month?
Unlock Your Shopify Store's Potential: Discover Insights with Mipler Sales Reports!
The Mipler application was developed not only to produce sales reports for Shopify stores. Inventory management, customer relations, delivery control, the correctness of payments - all these aspects of the business you can control with the help of Mipler reports.
Each report is highly flexible to your needs. You can set the necessary filters and add the necessary columns. If some information is missing, you can create custom reports yourself or with help. Here are some examples:
- You will be able to see how many sales are made from your site. In Mipler, we can build a report on sales from the site by applying a filter on the column Orders > Source name with the value "web".
- You will be able to understand how many sales occur for B2B customers. Use the Sales by Customers Tags Report and filter by the "b2b" tag.
- You can filter each sales report by billing or shipping address to understand which regions you have more buyers.
Mipler provides shared access for the entire team to reports, even if someone does not have access to the administrative part. You can download the information you receive to Google Sheets, CSV, or PDF files.
In addition, a daily email newsletter will keep you informed of the latest news from your store. Not only sales results but also other important information will come to your mail every day.
Important
The Sales Overview Report shows you the number of orders for each day and the total amount of sales. For the report to work correctly, it is important that several conditions are maintained:
- All your store settings are correct.
- There is no discrepancy between the actual prices and those displayed in the Shopify admin.
- You have connected the automatic calculation of discounts and taxes. Without it, your gross sales and total sales will not be true.
Of course, every business has unique needs, and we can easily create a Shopify Custom Reports for your store.
FAQ
What is a Shopify Sales Report?
Sales Reports provide information about the sales outcomes in your store. Mipler's Shopify sales reports are a category of reports that encompass a wide range of information regarding store activity. To accurately represent your store's efficiency, the report details sales results by time, demographics, product categories, and other factors.
How to download the Sales Overview report for a Shopify store in Mipler?
To download Sales Overview report you need to follow the next steps:
- Open the
Mipler Sales Overview Report and click on “Export” icon:
- Select the file format, add download options, and press “Export”:
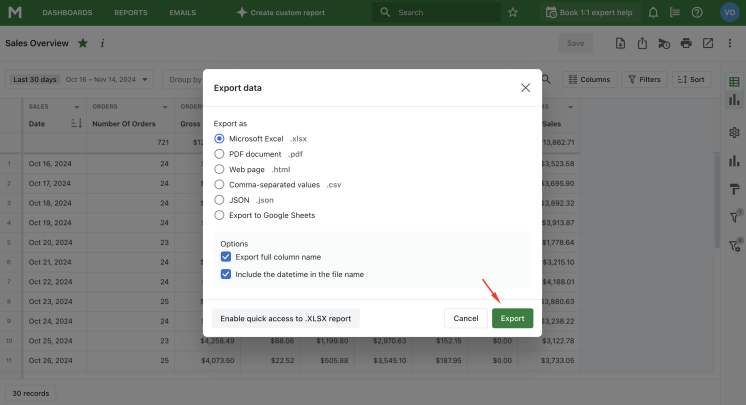
- Export the file and utilize your data!


How many types of sales reports exist?
Mipler Sales Reports for Shopify Stores has a lot of categories that allow you to see sales from different angles. It's easiest to divide your store's results into the following categories:
- Time
- General
- Product classification
- Customer
- Vendor
- Location
Will I have real-time data in Mipler reports, or will there be delays?
Mipler provides you with real-time data, ensuring that your reports reflect the most current information about your Shopify store's performance.
