In order to remain competitive, stores cannot be allowed to use only intuition when making important decisions. Shopify provides merchants with powerful tools to monitor and analyze their performance. Shopify Reports make it possible to make all decisions regarding development based on analyzed data.
One of the ways to classify and analyze products is to assign tags. Mipler for Shopify tag reporting helps you track the number of purchases of different products you've grouped with tags.
Why Are Shopify Tag Reports Important
A deeper understanding of your product's performance is critical, and tag-based reporting offers a unique opportunity to do just that. By analyzing sales data grouped by tags, you can clearly see the popularity of different products. This can help you adjust inventory levels, marketing efforts, and even product recommendations. For example, a seasonal collection tag can indicate peak sales times, allowing you to prepare in advance.
In addition, with the help of tags, you can separate not only products, but also buyers and orders. This way, you can see the different types of buyers who buy from you, such as B2B, B2C, and regular buyers. The report will allow you to see a list of B2B customers with their emails and the date of their last order.
What can you do with Shopify Product Tag Report
Importantly, tag-based sales reporting opens up significant opportunities for sellers. With these reports you can:
- Determine customer preferences;
- Study the features of the prevailing group of customers to track the success of various categories of products;
- Use inventory management;
- Express with marketing campaigns;
- Improve the procurement strategy.
If you correctly create tags for your products, orders, and clients, you can get a lot of information about how to better manage sales, configure the site, which products are better to display, and which ones should be taken away.
Benefits of Shopify Sales Report by Product Tag
Smarter decisions
Tags give structure to your data, making it easier to identify trends and act based on facts rather than intuition.
Flexible segmentation
You can group products, orders, or customers without being limited to Shopify collections, which allows more precise analysis.
Improved inventory planning
By tracking product performance through tags, you can prepare for seasonal demand or identify slow-moving items.
Better customer insights
Customer tags reveal who your buyers are (B2B, B2C, loyal customers), so you can adjust promotions and offers.
Campaign tracking
Order tags let you measure the success of discounts, special sales, or regional promotions.
Time savings
Automated updates and scheduling mean you spend less time preparing reports and more time using the insights.
Create Shopify Sales Report by Product Tag with Mipler
Mipler created Shopify tag reports so that stories can see how their actions affect sales. The peculiarity of tags is that users do not see them. Shopify allows you to assign tags to products, orders, and customers. Mipler allows you to analyze sales for different tags.
Sales by Product Tags Report
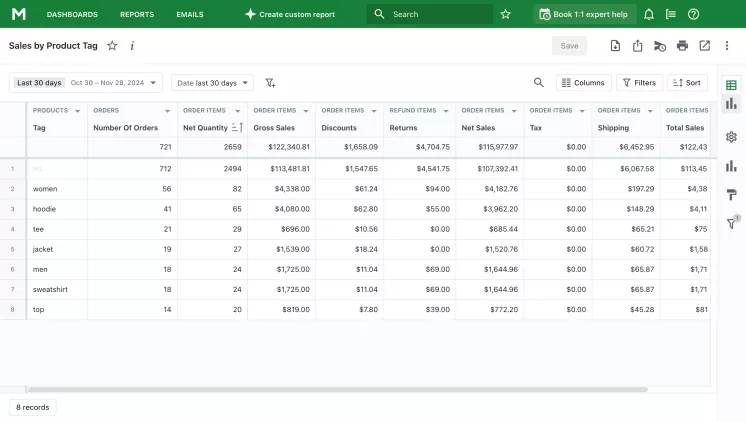
You can divide your products without binding them to collections and explore how to buy products in the groups you need. For example, mark products from one manufacturer with one tag. Then you will see how similar products from different suppliers are selling.
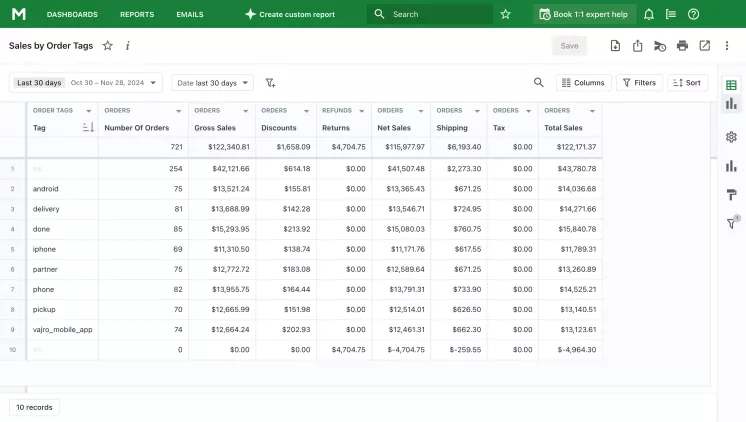
Sales by Order Tags Report
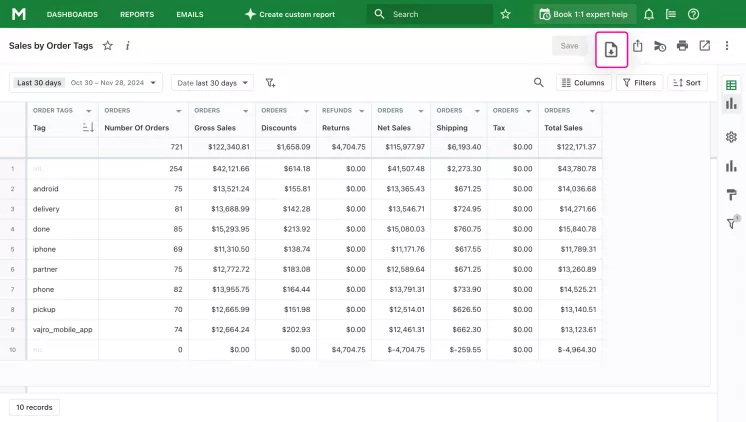
Tags for orders will help to separate them by status, place of delivery, promotions of your stores. For example, you can see and compare how many orders have been returned or how many orders were made during the Black Friday sales period.
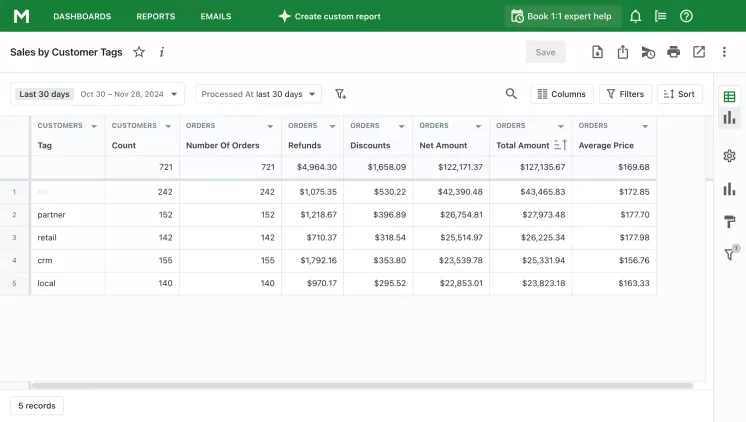
Sales by Customer Tags Report
Customer tags help store owners better understand who their core customers are and what their preferences are. You can divide them, for example, by whether it is a business that buys your products or a specific person. In this way, you will get a list of different types of buyers and can offer them promotions or special terms of cooperation that will really interest them.
Shopify Sales Report by Tag – what’s available with Mipler
In each report described above, you can see the following information about sales by tag:
- Tag
- Number of orders
- Net quantity of products
- Gross sales
- Net sales
- Shipping
- Taxes
- Total sales
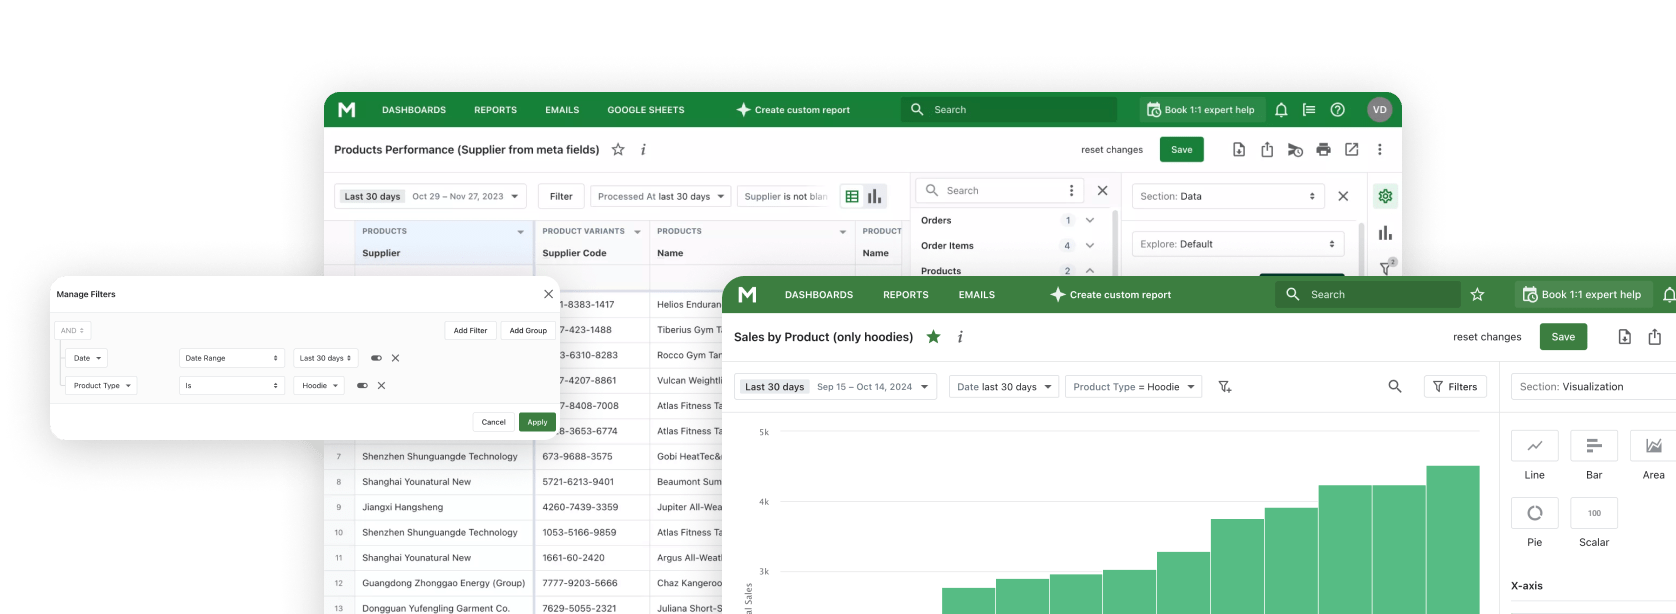
In those cases when you need to separate some information, you can use filters. They will help set a date range, hide unnecessary tags, and set a limit on the number of orders for a certain tag.
Custom columns will add the necessary information about sales by tags. You can insert them yourself, or you can contact the support service. We will help you get all the necessary information in one report.
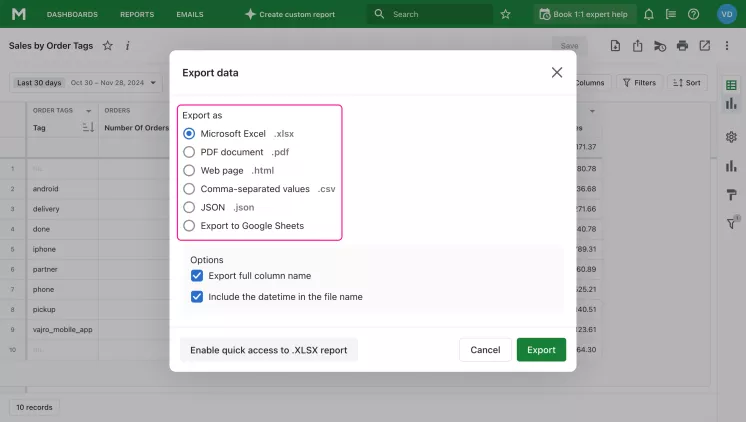
You can download reports in different formats: Microsoft Excel (.xlsx), PDF document (.pdf), web page (.html) or comma-separated values (.csv). In addition, if you want to share team access to one report, you can export the report to Google Sheets.
Build and automate your Shopify Tag Reporting and Optimize Your Store
In order for you to be able to automate some processes of your business:
- Schedule reports. The right reports will be automatically sent at the right time. You and your colleagues will receive them by email.
- Automatic data update. New tags or changes in product lists will be automatically taken into account when building reports.
- Pre-made templates. They help you get started quickly and adjust all the metrics as needed.
Important
For tag-based reports, keep your tags clear and consistent. A solid tagging strategy ensures accurate data, supports automation in Mipler, and helps you track products, customers, and promotions more effectively. With well-organized tags, you can segment sales, spot customer trends, and plan inventory or marketing with confidence.
FAQ
What are Shopify Tags?
Tags in Shopify are labels that you can put on products, orders, or customers to group them by the right characteristics. The tags are not displayed on your store's website and are not visible to your customers.
What are Shopify Sales Reports by Tags?
Shopify Sales Reports by Tags helps you analyze sales for different categories separately. Since tags are assigned to products, customers, and orders, sales reports are also created separately for them. Mipler offers Sales by Product Tags Report, Sales by Order Tags Report, and Sales by Customer Tags Report.
Why are Shopify Sales Reports by Tags important?
Shopify Sales Reports by Tags help you see patterns in purchases, the popularity of certain product categories, the success of promotions, and the characteristics of your customers. If you put the tags but can't see the results, then all your efforts were in vain. The reports provide an opportunity to see the results of the store's activity.
What is the best way to manage tags in Shopify for better sales analysis?
The correct implementation of text in Shopify enables better classification features that help improve your sales system. Business can track product performance and customer choices by using an organized tagging system that shows sales data. Mipler provides tag-based reports that allow you to analyze sales data by product tags to improve inventory management and marketing and business promotional approaches.
How to get a Shopify sales report by product tag from Mipler app?
- Open “Sales by Order Tag”, or “Sales by Product Tag”, or “Sales by Customer Tag” report.
- Click the "Export" button:
- Choose the format in which you want to download and click "Export":
