Every shop owner operating through Shopify needs to control their inventory management efficiently. Real-time inventory tracking helps prevent overselling and decrease storage expenses to deliver optimal customer satisfaction. The Inventory on Hand Report in Shopify delivers full inventory level details which allow you to make effective business choices.
The following guide provides detailed instructions about this important report and its benefits and explains how Mipler automates its creation processes.
Why the Shopify Inventory on Hand Report is Important
All business operations require inventory visibility as a basic requirement. Inventory on Hand Report in Shopify displays live inventory information which helps store owners avoid having insufficient inventory and also prevents excess stock storage.
Key reasons why this report is essential:
- Prevents stockouts – It helps you check availability of popular items for customers.
- Reduces holding costs – Decrease storage expenses since you effectively manage your stocks.
- Enhances demand forecasting – allows businesses to use historical data for making sales predictions.
- Supports multi-location management – monitor inventory quantities at different warehouses regardless of their location spread.
- Reduces manual errors – lower the number of mistakes made by human factors by automated reporting systems.
- Helps with compliance and audits – It provides correct inventory documentation for financial audits, tax reporting and working with industry regulations.

Benefits of the Shopify Inventory on Hand Report
Your operations gain substantial improvements by having a properly managed inventory report.
How stores perform today will help owners determine when to replenish stock while anticipating customer demands. Businesses can effectively predict seasonal market activities through historical data access to create stock distribution plans that prevent unexpected stock shortages.
When merchants use tools like Inventory on Hand Report or Shopify Inventory Reports and connect their stores to SAP or other enterprise resource planning (ERP) systems they can obtain improved data synchronization between their online storefronts and internal business activities. The system maintains accurate inventory data by minimizing errors resulting in current levels always staying up-to-date.
How the Shopify Inventory on Hand Report Helps You
Shopify Sales Reports operations benefit from effective inventory report management understanding. Mipler's solution offers benefits to implement as follows:
Key features of Mipler's Shopify Inventory on Hand Report:
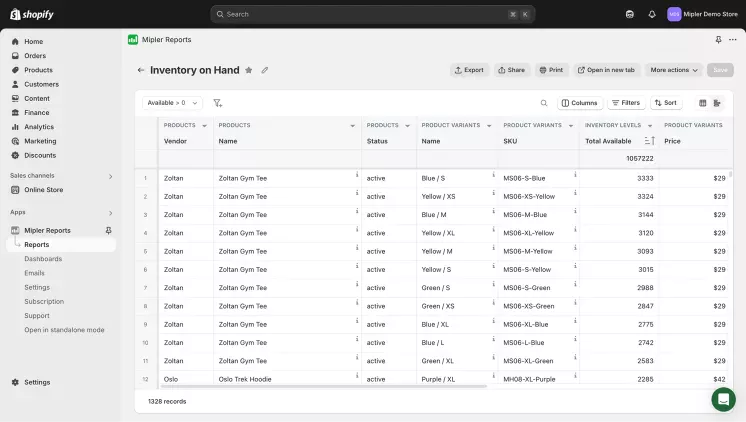
- Real-time inventory tracking – Monitor current stock levels for preventing overstocks and stopping excess stock.
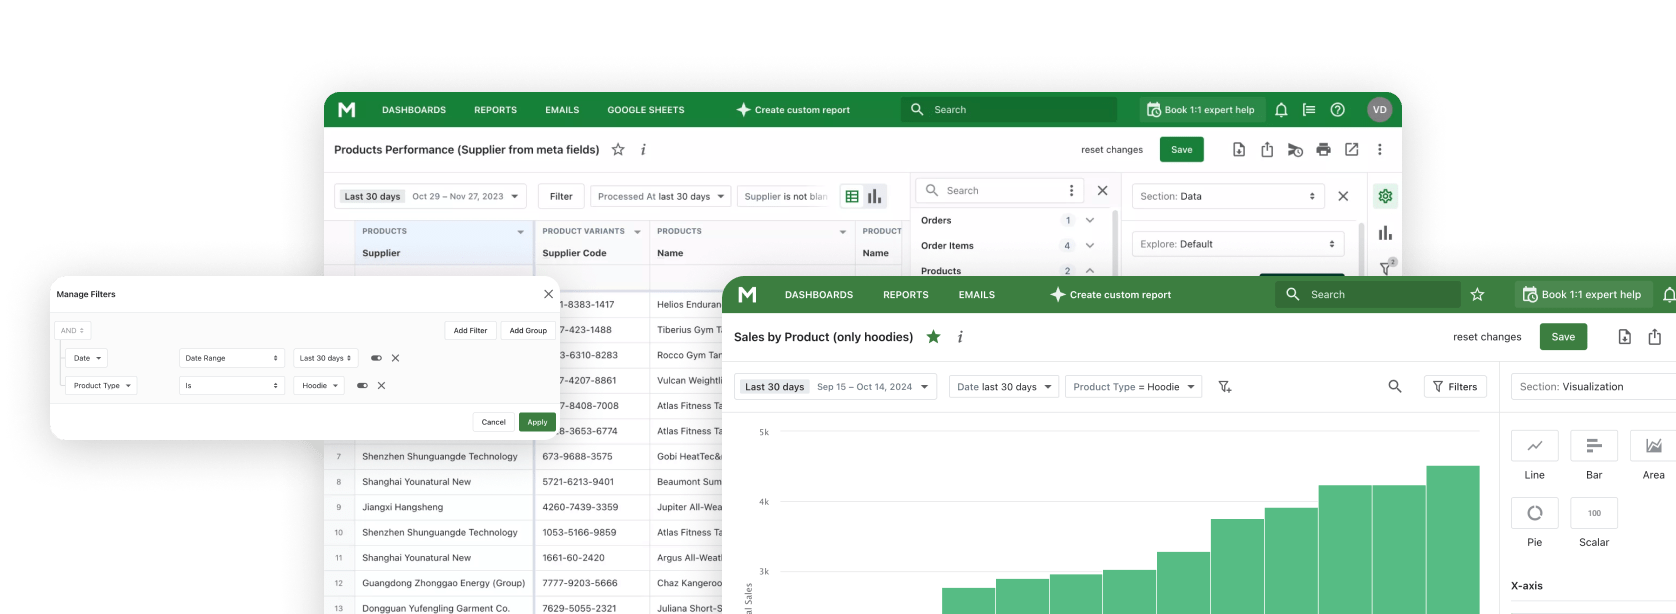
- Customizable filtering options – Use personalized filtering methods to their inventory reports through SKU, supplier names, warehouse placements and product classes.
- Integration with SAP inventory systems – Sync your inventory data with enterprise-level systems for enhanced efficiency with SAP on hand inventory report in Shopify.
- Historical inventory trends analysis – Use inventory past data to predict future business ideas and make purchases for warehouses.
- Multi-store tracking – Allows tracking inventory across multiple Shopify stores by one reporting interface.
Create a Shopify Inventory on Hand Report with Mipler
The procedure for creating on Hand Inventory Report in Shopify is very clear for users:
- Log in to your Shopify store and open the Mipler app.
- Select ‘Reports' from the dashboard.
- Choose ‘Inventory on Hand Report'.
- Apply filters to refine your data.
- Download or schedule automated reports.
Automate Your Shopify Inventory on Hand Report to Optimize Your Store
Automation leads to operational efficiency since it performs automatic real-time updates and eliminates manual labor from inventory management processes. With Mipler you gain control over automated functions which adapt to match your commercial needs.
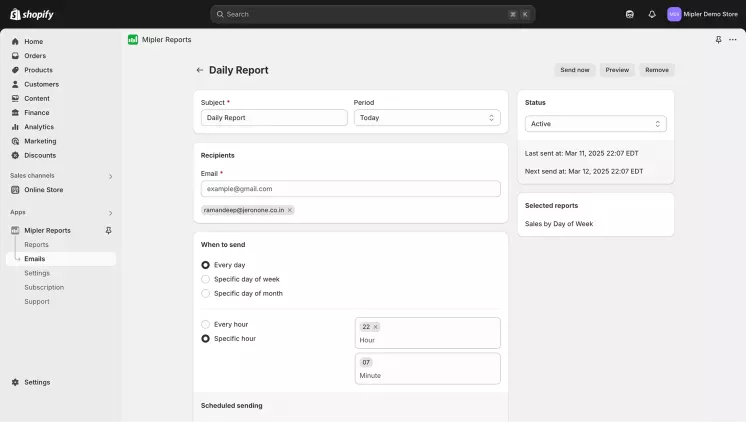
- Schedule daily, weekly, or monthly reports that are automatically sent to your email or integrated system.
- Work smoothly with Shopify inventory on hand report in SAP and different tools to deliver synchronized and accurate inventory records.
- Reduce manual work by bringing automation to track inventory in real-time.
- Export inventory data in various formats to analyze trends and forecast demand effectively.

Using automation features enables your business to eliminate repetitive work and reduce human mistakes to provide better inventory management which results in improved operational performance which leads to better customer experience.
Important
The right use of the Inventory on Hand Report in Shopify Reports will drive your operational work to the sky. Business productivity relies on reviewing inventory data with automated reporting systems for advanced supply chain operations that deliver smooth stock management infrastructure.
FAQ
How often should I run a Shopify Inventory on Hand Report?
The reporting frequency depends on your current sales quantity. Daily report runs should be performed at high-volume stores and smaller businesses can conduct this report weekly.
Does Mipler offer Inventory on hand report SAP integration functionality?
Mipler enables users to track inventory in real-time through its connections with SAP.
What filters can I apply to the Inventory on Hand Report?
Mipler allows you to apply multiple filters through SKU, Vendor, stock level, product variants, location among other criteria and price for each variant/item.
Can I automate inventory reporting in Shopify?
You can apply automated inventory reporting by using Mipler. Regular automatic report generation using scheduling helps you to stay updated about inventory status without manual work.
