Running a Shopify store isn't just about selling products, it's about understanding what's really driving your business.
As an example, one of our customers runs a small sustainable fashion brand. On the surface, her Shopify dashboard
looked promising, sales were increasing. But her profits weren't following. Curious, she digged deeper and built a
custom report by product tag.
That's when she discovered the issue: her "eco cotton" line had double the return rate
compared to other items.
Shopify's built-in reports show what happened, but they rarely explain
why.
That's where Shopify
Reports come in, apps and BI platforms that help you see patterns behind the numbers, track
profit by SKU, and forecast inventory before it runs out.
In 2025 reporting isn't just about data, it's about turning metrics into action, in real time.
What Are Shopify & BI Reporting Tools?
Shopify reporting applications are software that links to the information of your shop and generates comprehensive dashboards and custom reports. They examine the data of sales, customer behavior, inventory, and other e-commerce data and visualize it. General Business Intelligence (BI) tools, in contrast, consolidate information in all forms (marketing, CRM, finance, etc.) in single dashboards. As an example, Power BI and Google Looker Studio have capabilities to connect with Shopify data, but are intended to provide cross-company analytics.
Examples of Shopify Reporting
E-commerce stores use specialized reports that go beyond Shopify's built-in analytics. Examples include:
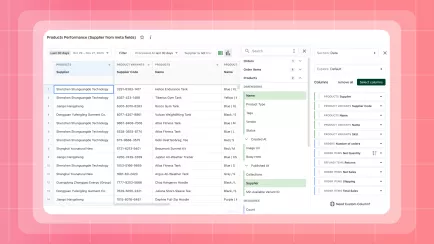
- Sales by Product Tag: Group products by tags (e.g., seasonal or supplier tags) to see which product groups are selling most.
- Inventory Gap Reports: Identify SKUs that are understocked or out of stock to prevent lost sales.
- Orders by Country: Break down orders and revenue by customer location (country/region) for market insights.
These Shopify reporting examples help merchants spot trends and issues that default reports miss.
Key Features of Shopify Reporting Tools
Top Shopify reporting tools share certain features:
- Shopify Integration: Native or easy connectors to Shopify and related apps (POS, AD platforms, etc.).
- Custom Dashboards & Templates: Drag-and-drop dashboards tailored to your KPIs, with pre-built report templates for sales, customers, inventory, etc.
- Visualization: Converts raw data into charts and graphs that anyone can understand.
- Automation & Export: Scheduling and exporting of reports (CSV/Excel/PDF) is built-in.
These features (easy Shopify connection, no-code interface, templates, automation) make it simpler for merchants to analyze data and act on it.
Why Reporting Tools Matter for Shopify Stores
Reporting tools are time-saving and show opportunities that are obscured in basic dashboards. They do not have to spend hours creating raw data in spreadsheets to create visual reports; they create them on-the-fly. The owners of the stores receive a summary of key metrics (sales, traffic, customer retention, etc.) across all channels. In the absence of such tools, dashboards of Shopify have the merchants in suspense mode - they might spend more on advertisements or fail to notice stock-outs. Summing up, specific tools avoid such problems by transforming the guesswork into the data-driven decision.
Explore related reports
Top 7 Reporting Tools in 2025 (Comparison)
This list highlights leading reporting tools for Shopify in 2025. Mipler is first, followed by a mix of Shopify-specific and general BI solutions:
The advantages of each tool are as follows: Shopify applications, such as Mipler and Report Pundit, are designed to use e-commerce data in a format (tags, customer groups, inventory), whereas BI giants, such as Power BI or Looker Studio, combine Shopify data with others.
As an example, Mipler offers product tag or customer segment custom
dashboards, and also highly custom metrics (customer RFM score, inventory gap warning) not native to Shopify
Analytics.
The in-house Analytics (included with all plans) provided by Shopify has simple dashboards.
| Tool | Shopify Compatibility | Best For | Free Plan | Pricing (from) |
Shopify App |
Advanced Shopify Reporting |
Yes |
From $9.99/mo |
|
Built into Shopify |
Store performance overview |
Yes |
Included with all plans |
|
Shopify App |
E-commerce attribution |
No |
Starts at $99 for 50k pageviews |
|
Microsoft Power BI |
Integrates via connector |
Enterprise BI & reporting |
Yes |
Pro $14.99/user |
Google Looker Studio |
Connects via Google APIs |
Free dashboards & reports |
Yes |
Pro $9/user |
Zoho Analytics |
Integrates via API |
Multi-source BI |
No |
$48/user/mo |
Tableau |
Integrates via API |
Advanced analytics |
No |
From ~$70/user |
Report Pundit |
Shopify App |
Custom Shopify reports |
Yes |
From $9/mo |
How to Choose the Right Reporting Tool for Shopify
Choosing a reporting tool for Shopify stores can be overwhelming — there are dozens of options, from simple dashboards to full BI platforms. Use this practical 5-step checklist to find the one that fits your store's goals and tech level.
1. Define what you want to learn
Ask yourself:
- “Do I need a quick overview of sales and profit?” → Start with Shopify Analytics or an app like Mipler.
- “Do I want to blend marketing, CRM, and finance data?” → Go for Power BI, Tableau, or Looker Studio.
2. Check integration & setup
Look for one-click connectors to Shopify. Tools like Mipler integrate instantly; BI tools may need API setup or a data connector.
3. Test customization & templates
Try building a report you'll actually use — for example, “Sales by Product Tag” or “Profit by Customer Segment.” If you can't do that in under 10 minutes, the tool may be too complex.
4. Automate your insights
Make sure the app can schedule and send reports automatically (email, Slack, Google Sheets).Automation saves you hours every week.
5. Plan for scale
If you manage multiple stores or channels, check for multi-store support, team sharing, and API exports. These features pay off as you grow.
Don't choose the "most powerful" tool, choose the one your team will actually use every week.
Business Intelligence vs. Shopify Reporting Tools
The scope of general BI platforms is not the same as that of Shopify-specific. BI tools (Power BI, Tableau, etc.) are intended to work with any data: they are able to unify several sources, however, it is necessary to customize them. Shopify reporting applications are specifically designed to work with store data (Mipler, Report Pundit, and others) and have pre-built e-commerce measurements. As an illustration, it is possible to import Shopify sales data to Power BI, however, you need to design reports. Mipler, in its turn, is plug-and-play: it makes e-commerce dashboards (sales by tag, RFM, etc.) on your behalf. BI tools provide flexibility to the analysts, whereas Shopify apps provide actionable insights within a shorter period.
Conclusion: Choosing the Best Shopify Reporting Tool in 2025

Reporting tools are necessary as the Shopify businesses grow. The in-house analytics of Shopify are a decent start, and high-level insights may need specialized software. The future of Shopify reporting will be a mix of a user-friendly (no-code dashboards) and effective e-commerce analytics (customer segments, profitability, etc.). As an example, Mipler (the top Shopify reporting application) is an advanced dashboard and custom report for small and large stores.
FAQ
What is the best reporting tool for Shopify?
Many merchants prefer Shopify-focused apps such as Mipler for detailed store analytics. Larger businesses may choose BI platforms like Power BI or Tableau to integrate Shopify data with other systems. Select the tool that best fits your budget, technical skills, and reporting needs.
Can I build custom reports in Shopify?
Shopify's built-in analytics provide only preset reports depending on your plan (Advanced and Plus plans unlock more). In practice, the default reports do not support deep customization. For fully customizable dashboards, merchants typically use external tools such as Mipler.
Which BI tools work with Shopify?
Popular BI platforms like Power BI, Tableau, and Google Looker Studio all connect to Shopify via APIs. For example, Power BI is commonly used due to its visualization capabilities and strong integration with Microsoft tools.
Are there free Shopify reporting apps?
Yes. Mipler offers a free plan with limited features. Google Looker Studio is also free, and Shopify's built-in analytics are included with your subscription plan.