Inventory is a non-permanent asset. You are constantly selling products and buying new ones. That is why stocks are your riskiest investment and you never know when they will pay off. This is where the risk lies. Understanding how much time you will spend on selling goods will allow you to minimize it. The number of days for which your power will bring profit is the most accurate indicator.
In the professional term of economists, this indicator is called days of inventory. Using the results of your store, you can accurately calculate the number of days it will take to sell the entire batch of goods. The received number of days will give you answers to the following questions:
- When do I need to order the following products?
- How many days should I expect to service a batch of goods?
- How effective is my sales team?
- Do I have enough of this quantity of goods to satisfy the demand?
- Will I have enough goods for the next delivery?
Inventory on hand days may not seem like an important indicator, but it can show you the effectiveness of two aspects of your business - inventory management and the sales capacity of your store. You will be able to:
- Maintain the correct balance of stocks
- Meet the needs of customers without losses
- Avoid the situation of excess or shortage of stocks
- Reduce the risk of crisis
- Ensure stable sales
This will happen if you take this indicator into account when planning your business and purchasing goods.
In this article, we'll look at how to calculate days on hand. You'll see the main formulas with simple explanations and examples. We'll also cover what to do if the results don't look good and how Mipler can help with the calculations.
We offer to understand this issue together: "How to calculate days on hand?". In addition to the formulas, you will find explanations and examples for them in this article. You will also be able to figure out what to do if you are not satisfied with the results and how Mipler can help you with calculations.

What are inventory days?
Let's consider a more precise definition of the indicator:
Days of inventory is a financial ratio that indicates the average number of days it takes a company to sell all of its inventory.
This indicator is used to determine the effectiveness of inventory management and evaluate your ability to convert inventory into sales. In general, this is another way to determine business efficiency.
In the classic economic literature and in other articles on the Internet, you may find that inventory days can be called in different ways. The most common names are days sales of inventory (DSI), average age of inventory, inventory on hand days, days inventory outstanding (DIO), days in inventory (DII), or days sold in inventory. Unless some additional explanations are given, then usually, this is one and the same concept. The difference can be only in the method of calculating this indicator.
Given the name of this ratio, it is clear that it is part of inventory management. It is not mandatory. However, it is worth paying attention to it if there are problems with the delivery or production of products. If you do not have enough time for production, or there is a surplus that you could not sell. True, you do not have to calculate the inventory days if you are satisfied with the results of your store.
In general, the main purpose of the indicator is to show how many days you will need to prepare new supplies. But apart from that, you will also be able to get information about solving some other problems. For example:
- Procurement management and budget planning are the first problems solved by correctly understanding and using the indicator.
- Secondly, if you calculate inventory days separately for each type of product, you can immediately see the difference in their popularity and demand
- Thirdly, the value of this indicator indicates the results of your sales activities
Explore related reports
Formulas definition
Managing inventory is all about balance. Too many stock ties up money, while too little leads to lost sales. To keep control, businesses use a few simple formulas to measure how long products stay in inventory. Below, we have listed our most common formulas, which we'll explain in this article.
1. Days Sales of Inventory (DSI)
DSI = Average Inventory / COGS * Days in Period
We use DSI to show how many days, on average, it takes to sell all the inventory you have.
Example:
- Average Inventory = $250,000
- Annual COGS = $1,825,000
250,000 / (1,825,000 / 365) = 50 days
This means it takes about 50 days to sell your stock. If you want to avoid running out, you should plan reorders around day 40.
2. Average Inventory
Store owners use it to represent the typical inventory you hold during a period. This number is often used in other formulas.
Average Inventory = (Beginning Inventory + Ending Inventory) / 2
Example:
- Beginning Inventory = $200,000
- Ending Inventory = $300,000
(200,000 + 300,000) / 2 = 250,000
By using this calculation, on average, you kept $250,000 worth of inventory during the year.
3. Inventory Turnover Ratio (ITR)
ITR shows how many times you sold and replaced your inventory within a period. Higher is usually better — it means products sell quickly.
ITR = COGS / Average Inventory
Example:
- COGS = $1,825,000
- Average Inventory = $250,000
1,825,000 / 250,000 = 7.3
By applying this formula, we sum up that your inventory rotates about 7.3 times per year.
4. Days in Inventory (via Turnover)
We also have another way to measure how long inventory stays in stock, but using turnover speed.
Days in Inventory = 365 / ITR
Example:
- ITR = 7.3
365 / 7.3 ≈ 50 days
By applying a different approach, on average, your stock stays in inventory for 50 days, which matches the DSI calculation.
These formulas help you understand how quickly products move, when to reorder, and how efficiently you manage stock. Used together, they give a clear picture of your inventory health. But let's deep dive and get to know which information we use to get these numbers for you to have a clear understanding of how to and for what purposes we can use them.
How do you calculate inventory days?
Two ways can be used to evaluate a day's inventory. Your choice depends on how you view the day's inventory and what data you are more comfortable using. We will get the same result; we will just look at inventory and inventory days differently.
The first method offers a seller's view - how many days will it take you to sell an entire lot of stock? The second shows the warehouse manager's point of view - what the stock turnover is and how many days they are in the warehouse. This method should be used depending on which approach is closer to you.
Days sales of inventory formula (DSI)
The first way to calculate inventory days on hand is called Days Sales of Inventory (DSI). It uses the cost of inventory and the cost of goods sold. This method works well if you measure results by sales, because the data is already available. It shows how many days, on average, it will take to sell your stock. The formula is below.
DSI=(Average inventory/COGS)*Days in accounting period
Let's see an example. Here are your results for the year: average inventory $250,000, cost of sales $1,825,000. Your formula will look like this::
250,000 / (1,825,000 / 365) = 50 days of inventory on hand
And after this simple manipulation you know that for the next year every 50 days you will have new products. Based on the received data, you need to place an order with suppliers on the 40th day, because the delivery takes 9 days. + you can plan the cleaning of the warehouse for day 49, because the warehouse will be almost empty in the evening of this day. The example is conditional, but the logic is approximately as follows.
In the example, we use 365 days because we are calculating the DSI for a year. But 90 days - a quarter or 30 days - a month are also often used. The choice depends on the specifics of the business.
Average inventory calculation
Average inventory is the cost of your inventory. To calculate it, you can use one of two formulas:
Average Inventory=Ending Inventory
or
Average Inventory=(Beginning Inventory+Ending Inventory)/2
Formulas are selected depending on the accounting method. If you check inventory days only at the end of the period, then take the first method, if during the entire reporting period, then the second formula will provide you with accurate data, and not the first.
! Remember that the Average Inventory includes all categories of inventory: finished products, work in progress, raw materials, and current payments.
Inventory turnover method (Inventory turnover ratio)
In the end, we got to the second method. In some ways, it is simpler than the first. But only if you have the necessary information.
This point of view suggests looking not at sales results, but at the speed of updating the assortment in the warehouse. To put it simply, we will find out how long the stock remains in stock. Only one variable is used for the calculation - inventory turnover.
ITR=(1/inventory turnover) * 365
Example (same as above): You are a warehouse manager and you mentioned that you purchase new products approximately 7.3 times a year. Then you just need to divide 365 by 7.3 and you will get a result of 50. This means that every 50 days you buy goods again.
For your information: inventory turnover equals COGS/Average inventory. If you don't calculate COGS and average inventory, but know how many times in the reporting period you buy new goods, inventory turnover ratio is your best variant.

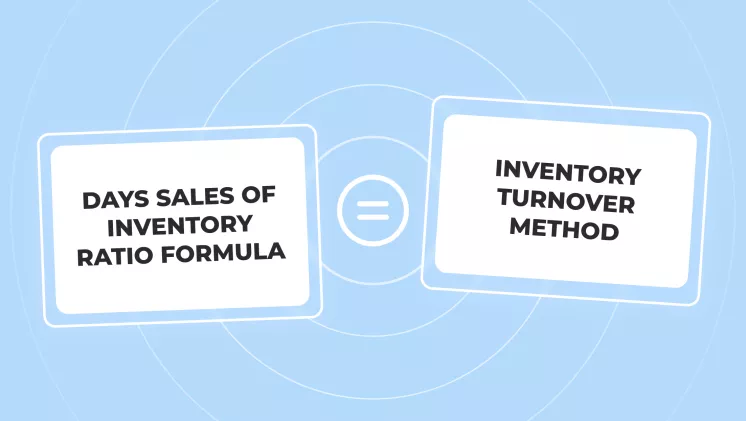
Days sales of inventory ratio formula = Inventory turnover method
As we said earlier, inventory days on hand can be calculated in two ways, but you will get the same result. This can also be seen in the example we gave. From a mathematical point of view, equality will look like this:
(Average inventory/COGS) * 365 = (1/inventory turnover) * 365
The comparison looks very interesting, because you can immediately notice that DSI and inventory turnover are almost opposite concepts. It is only necessary to multiply the inverse value of inventory turnover by the period for which we are checking. This is the main idea - to give an opportunity to solve the problem in two ways, to approach it from two sides.
Tips for calculating inventory days
In addition to providing you with the tool, we would also like to help evaluate the results of using it. Here are some tips on how to calculate and use inventory days on hand:
- Use the method that is more convenient for you. It is better to use the data that is available than to make a mistake in calculating new indicators for you.
- Make calculations with the first periodicity, for example, once a quarter, to keep your hand on the pulse. For the good operation of the store, the number of days during which stocks remain in stocks should be as small as possible. Then this indicates that the efficiency of inventory and sales management is high. It is in order to avoid unpleasant surprises that you should constantly check the results.
- Consider seasonality to avoid running out of stock. For example, before the holidays you may want to increase inventory to prepare for higher sales, which makes this indicator especially important. On the other hand, after the season ends, the indicator may rise above the normal range, showing that products are staying in the warehouse longer
- Cross-functional collaboration - work closely with sales, procurement and finance to gather comprehensive data and analytics.
Address sluggish inventory movement
What if your items are selling very slowly? It is important to investigate the reasons for this negative trend. Slow inventory movement can indicate inefficiencies and lead to higher storage costs. To solve this problem, pay attention to the following points:
- Compare only with indicators in your area. The norm is different for each type of business. It depends on the shelf life of the goods. For cars - several months, for food - several days.
- Remember that seasonality has a big impact on this indicator, so it's critical to take it into account.
- When analyzing the obtained results, take into account that you entered many variables during the calculations. And if you are not satisfied with the results, then this may be the result of a change in some indicator, and not the situation in general.
- The indicator can freeze from the method of inventory management. If you don't have it, enter it, and if you don't like the results of the existing one, change it.
- Increase Sales Efforts. Implement targeted marketing campaigns to boost sales of slow-moving items.
- Review Supplier Agreements. Negotiate more flexible terms with suppliers to adjust orders based on sales trends.

How can Mipler help you calculate days of inventory?
Mipler offers advanced inventory management solutions that simplify the calculation of inventory days. With features like real-time data tracking and automated reporting, Mipler helps businesses. We can help you with your calculations in the following ways:
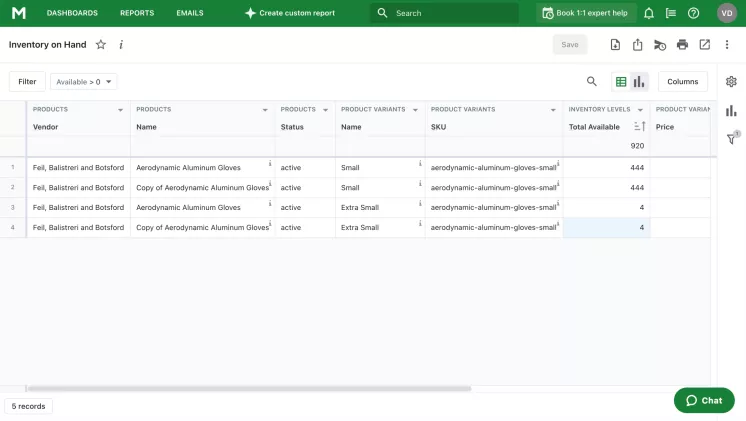
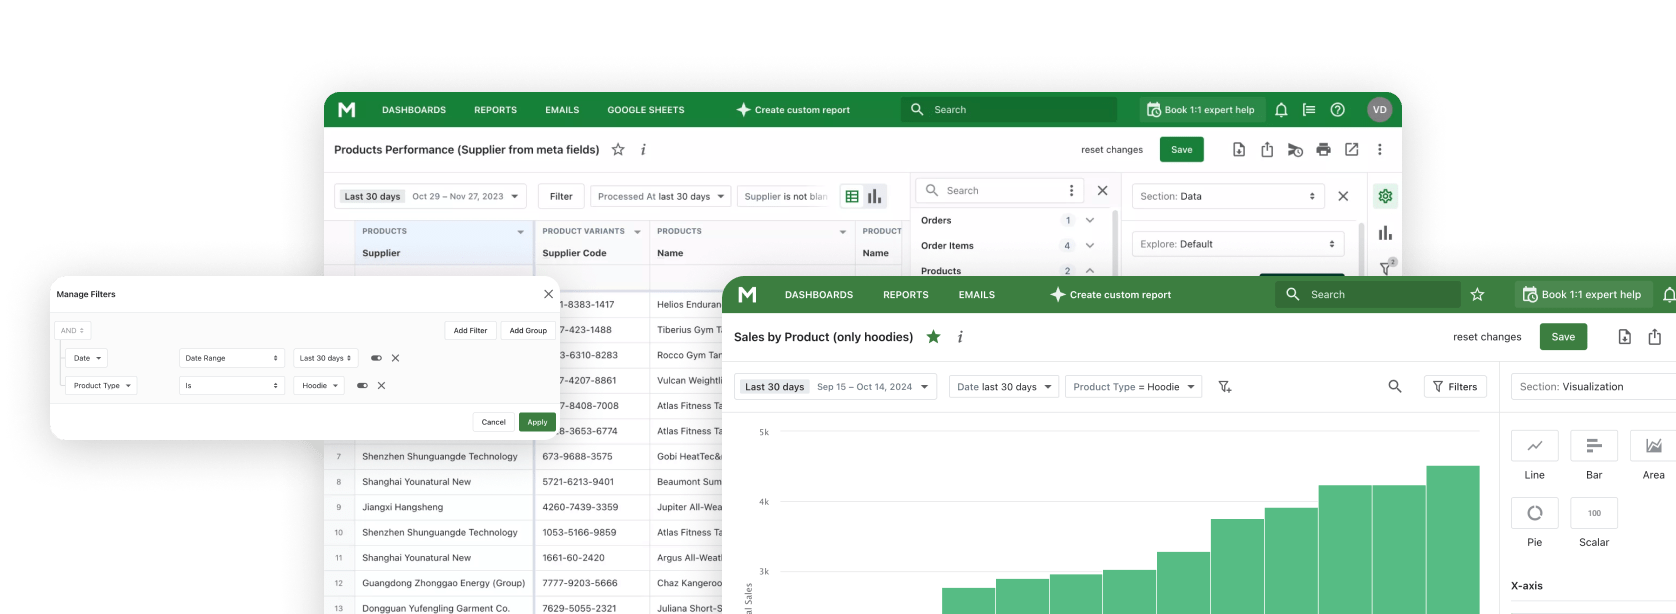
- We will provide accurate and organized data for calculations with the help of Shopify Inventory Reports.
- We can make a custom column that will calculate the value of inventory days on hand for you.
- We can prepare a separate Shopify Report in which all variables and the results of calculations with them will be displayed.
Frequently asked questions about inventory days
What does days in inventory measure?
Days in inventory shows how long, on average, it takes a company to sell its products. It reflects how well the company manages its stock and turns it into sales.
How to compute days in inventory for each company?
To compute days in inventory for each company, gather data on average inventory levels and COGS, then use the appropriate formula (e.g., average days in inventory, DSI ratio) to calculate the metric. Adjust calculations based on specific business models and industry standards.
What is the average number of days on hand?
The average number of days on hand indicates the typical duration that inventory is held before it is sold. This metric provides insight into inventory turnover rates and helps businesses maintain optimal stock levels.
How to calculate inventory days on hand?
You can calculate it in two ways:
(Average Inventory ÷ COGS) × Days in the periodor
(1 ÷ Inventory Turnover) × 365
Both formulas give the same result, so you can use whichever is easier for you.


