You have probably heard and read more than once that inventory management is very important. You may even use ABC analysis for inventory management. We won't repeat that here.
Instead, we want to introduce an additional way to analyze your products, which, together with other inventory planning techniques, can solve many inventory problems.
XYZ analysis will help you identify the stability of product demand, ensure timely purchases, and avoid costly mistakes.
In this article, we will use an example to show how, simply by having a list of products and the time of their purchase, you can classify them by popularity. After conducting this analysis, you will be able to predict the demand for your products and make or purchase them in time.
What is XYZ analysis?
Consistency of demand is the main criterion by which XYZ analysis divides your products into groups. That is, it is considered how often one or another product is bought from you and in which year. Neither the price of the product nor its popularity at the moment of time are important.
The official definition of XYZ analysis is as follows:
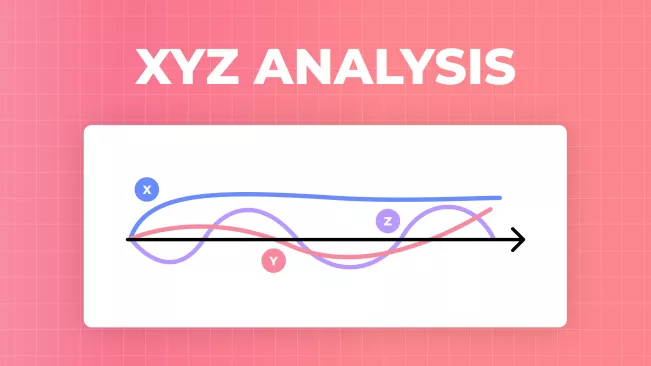
XYZ analysis is a method of product analysis that allows you to classify products according to the stability of demand into three groups: X, Y, and Z.
The main principle of this analysis is to understand how often a certain product is bought and how stable this demand is over some time.

XYZ classification
-
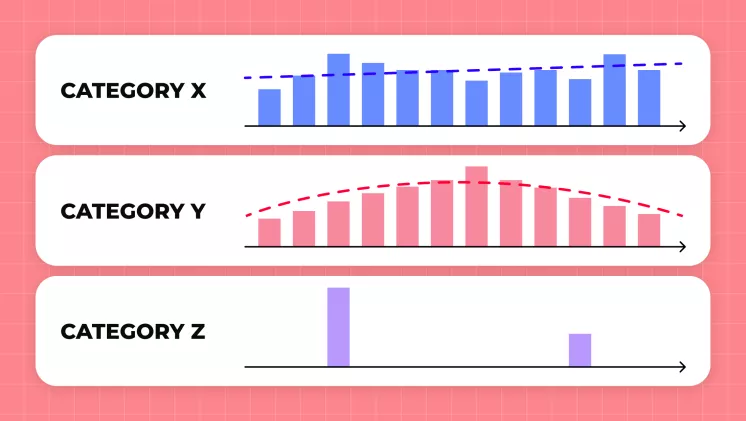
Group X: These are products that are in stable demand.
Most likely, these are your main products. They are regularly bought, accordingly, and the income from their sales is stable. These products should be emphasized when planning sales, purchasing stocks, and marketing activities.
-
Group Y: Goods belonging to this group have variable demand or otherwise moderately stable demand.
This group usually includes seasonal or trendy products. For such goods, predicting peak demand and adjusting stocks in time is important.
-
Group Z: Demand for goods from this group is irregular.
Because these goods are rarely sold, it is difficult to predict when they will be needed.
How to implement XYZ analysis of your products
Product evaluation criteria using XYZ-analysis
In order to assign a product to one of the groups, the coefficient of variation is calculated for each of them. The smaller the coefficient of variation, the more stable the demand, and therefore the more popular the product.
The coefficient of variation (CV) is a statistical indicator that helps determine how much the indicator varies from its average value.
Conventionally speaking, you have an average of 20 phones of each model bought every month. And 30 units of one phone model are bought only in June. And another model - 10 times, but every month. The coefficient of variation will determine by how many percent the demand for each model deviates from the standard model. And on the basis of this, it is possible to say which product has a stable demand, and which does not.
X-products
- Have high and stable demand.
- The coefficient of variation for such products is usually less than 10-25%.
- These products are sold regularly without significant changes throughout the year.
Y-products
- Have moderately stable demand, with seasonal or other predictable fluctuations.
- The coefficient of variation for such goods can be within 25-50%.
Z-products
- Have unstable demand with high variability.
- The coefficient of variation for these products exceeds 50%.
- Their sales can be random and difficult to predict.
The formula for the coefficient of variation:
Where:
- σ - is the standard deviation (the spread of values relative to the mean).
- X - is an average value (for example, the average number of sales over a period).
Step-by-step instructions
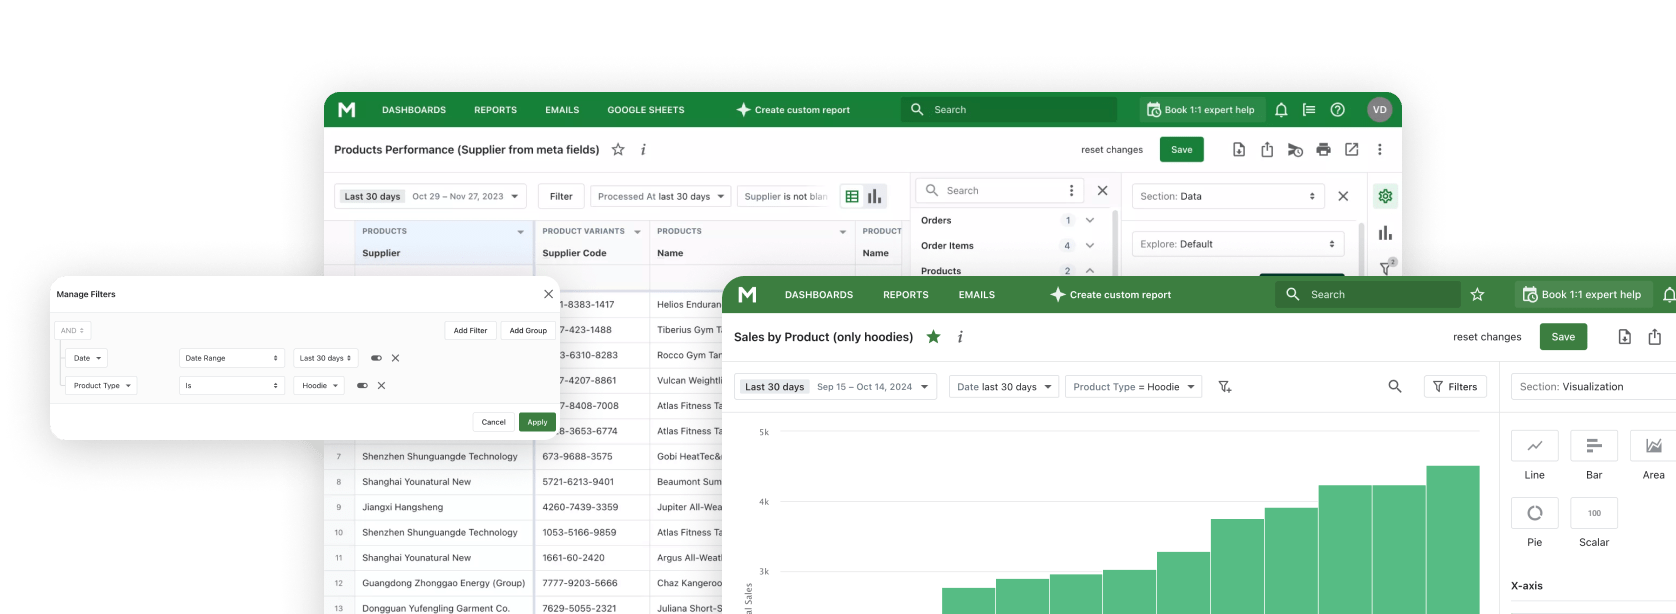
We will tell you the process of XYZ analysis of your products. Using this algorithm, you can analyze with personal calculations, Excel, Shopify, or Mipler reports. With enough data, you can easily classify your products.
Collection of sales data.
You need to collect the following information in one table:
- The names of your products
- How many were sold for each product each month
Most likely, such a table should be included:
| Month | Product A | Product B | Product C |
|---|---|---|---|
| January | 100 | 150 | 200 |
| February | 110 | 180 | 50 |
| March | 95 | 170 | 300 |
| April | 105 | 160 | 400 |
| May | 100 | 190 | 100 |
| June | 120 | 200 | 250 |
Calculation of average demand and standard deviation for each product.
For each product, you need to calculate the average demand (the average number of sales over a period of time) and the standard deviation, which shows the spread of values around the average.
The formula for average demand looks like this:
- is the number of product sales for a certain period. n is the number of periods (for example, the number of months or weeks).
Formula for standard deviation:
Calculation of the coefficient of variation.
The coefficient of variation shows how much the demand for a product changes relative to its average value. It is calculated as the ratio of the standard deviation to the average demand.
Classification of products.
After calculating the coefficients of variation for each product,
the products are divided into categories:
- X: low coefficient of variation (< 25%).
- Y: average coefficient of variation (25-50%).
- Z: high coefficient of variation (> 50%).
Example of XYZ calculations
For Product A:
Average demand:
Standard deviation:
Coefficient of variation:
For Product B:
Average demand:
Standard deviation:
Coefficient of variation:
For Product C:
Average demand:
Standard deviation:
Coefficient of variation:
Analysis result:
- Product A belongs to the X-category (low variation, stable demand).
- Product B also falls into the X-category.
- Product C has a high coefficient of variation and belongs to the Z-category.
Using results of XYZ analysis for Shopify stores
This information can be used to adjust inventory, marketing efforts, and even sales strategy. Products with constant demand are your foundation, your trump card up your sleeve, and require your main promotion efforts.
X-products have high priority. They should always be kept in stock as they generate steady income.
Y-products should be carefully monitored, especially during peak seasons, to avoid stock shortages or overstocking.
Z-products require special attention because their demand is the most unpredictable.
For these products, it is useful to use different marketing strategies to drive sales or sales.
How can you use the results of the analysis?
The results can be used for purchasing planning and sales forecasting. If you know which product will be popular in which period, you can purchase or manufacture products in advance. This analysis will be especially valuable for clothing stores, stores with in-house production, and stores where product delivery takes a long time.
If you distribute products according to XYZ, the store can plan how many products it can produce at a given time and when it should open registration for pre-order.
You will also be able to control stocks: X-products should be in stock at all times, and for Y and Z products, you should reduce the stock level in off-peak seasons to avoid unnecessary costs.
To ensure that your stocks did not disappear and were always in the right amount in the warehouse, you can
use our Google Sheet inventory control template.
In the article, we told how to use it.
Your marketing efforts can also be adjusted based on the popularity of the products.
- X-products can be promoted as core products on which your business is built.
- For Y-products, you can create email newsletters before the start of the season to stimulate demand.
- Special promotions or discounts can be held for Z-products to boost their sales.
How to maximize the benefits of XYZ analysis
If you're not convinced by our previous description of this analysis method, consider the suggestions below.
You can combine the results of XYZ analysis with other actions.
Then, you can maximize your profit.
XYZ+ABC
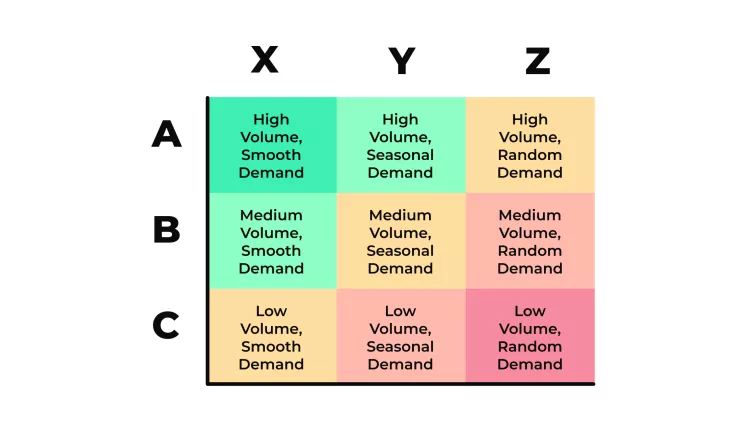
In addition to XYZ analysis, there is ABC analysis of products. Very often, these methods are combined in
order to segment products in greater detail.
Look at the picture below. It shows how you can analyze your products more deeply.

XYZ+Marketing
You can use the information from the analysis to stimulate demand with marketing at the right time. For seasonal products, this can be email marketing, advertising that reminds people of the coming season, or advertising campaigns that announce bargains.
You can also create a combination of popular and non-popular products. For example, you will get a discount if you buy hand cream and hand peeling. In this way, you can sell your goods in your warehouse and stimulate the sales of your popular goods.
XYZ+Inventory management
For effective inventory management, the following ratio of goods of each group in the warehouse should be observed:
- Products from group X: 70-80% of all stocks
These are products with predictable and stable demand, so you need to have sufficient quantities. Since the demand for them is stable, the risk of excess or shortage is minimal. This group of products is the main one for constant stock replenishment. - Products from group Y: 15-20% of all products in stock
These are goods with seasonal or periodic fluctuations in demand. They need to be stocked in smaller quantities than X-products, but the expected peaks in demand (for example, during holidays or seasonal discounts) must be considered. - Products from group Z: 5-10%
These are goods with high demand variability, so they should be ordered or kept in stock in minimum quantities. The high risk of backlogs or sales delays makes these items a lower priority for continuous replenishment. However, they may be worth offering during sales or other promotional tactics.
Conclusion
Your product is your main product. Some are more profitable in sales, and some are less profitable. By understanding what to focus on, you will be able to:
- Increase sales
- Manage your inventory efficiently
- Improve marketing campaigns
- Stimulate demand
- Buy goods on time
XYZ Analysis can classify your products to following groups:
- X-products are the core of your business and require the most focus
- Y-products should be adjusted for seasonality or trends
- Z-products require special care due to their unpredictable demand.

