We noticed that it became more difficult to understand whether a customer will return if we do not conduct an analysis. We discovered that there is a method that allows you to assess how customers feel about a store or brand.
The best indicator of a customer's loyalty is how often he returns to you, how long he has been with you, and how much he bought your products for. This method is called RFM. R - recency, F - frequency, M - monetary value are the categories by which you will rate your customers.
To make it easier for you to use this analysis, we have developed a Google Sheet Template. It will automatically categorize your users. As a result of the analysis, you will receive the following lists of your customers:
- those who love your brand and come to you often
- loyal, but can change their mind
- can become loyal
- those who may soon forget about you
- those who forgot about you
- new clients
In this way, you will know which group prevails and where to direct your efforts. This article is dedicated to explaining the principle of operation of this method. However, we want to pay much more attention to how to use the research results. So, let's start with a simple question...
What is RFM analysis?
This is a way of analyzing the loyalty of your existing customers to your store.
This is a way to know where to focus your marketing efforts.
This is your tip on how to segment your buyers.
Definition of RFM segmentation
If we combine all the possibilities of RFM analysis and its features, we will get the following definition:
RFM (Recency, Frequency, Monetary) is a customer base analysis method that allows you to segment customers according to three key indicators. These indicators determine how recently the customer has made a purchase, how often he purchases it, and how much money he has spent in the store. With this approach, it is possible to identify the most valuable customers who generate the most revenue and develop special marketing strategies for each segment.
These indicators are taken because they can show whether customers want to come back to you again or not. What is more important is that there are no established standards for these indicators. Each store is unique, so it is not compared with others but finds the norm for itself independently.
In general, the analysis process looks like this:
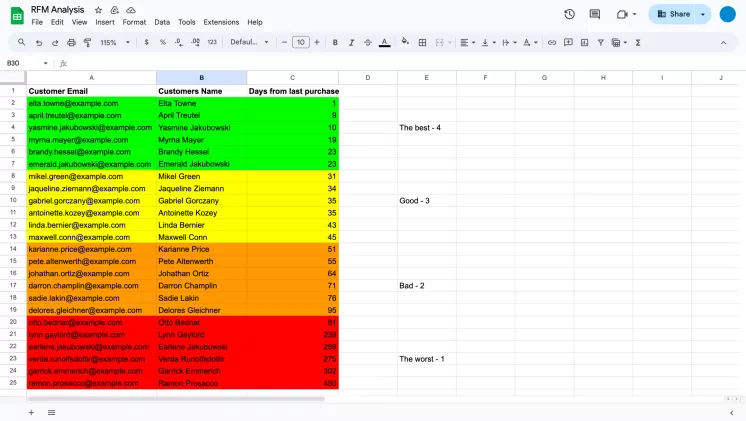
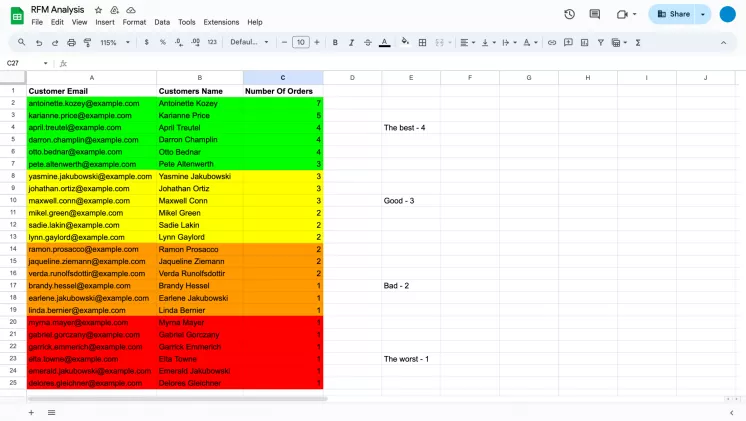
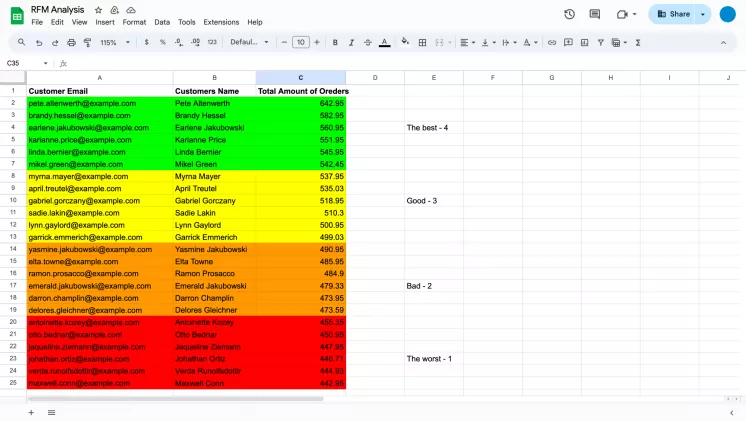
- We compile a table for each indicator. It displays personal information about the buyer and a column that helps evaluate every aspect. For Recency, the number of days since the last purchase. For Frequency, the number of orders each buyer made. For Monetary, the cost of all orders.
- According to this indicator, we sort your customers from the best to the worst.
- We divide the sorted list into quantiles, that is, into 4 parts.
- Users in each quantile are assigned a point.
- We sum up the points obtained for each indicator and rank the buyers from best to most.
- We divide the received list into groups, each reflecting buyers' loyalty to your brand.
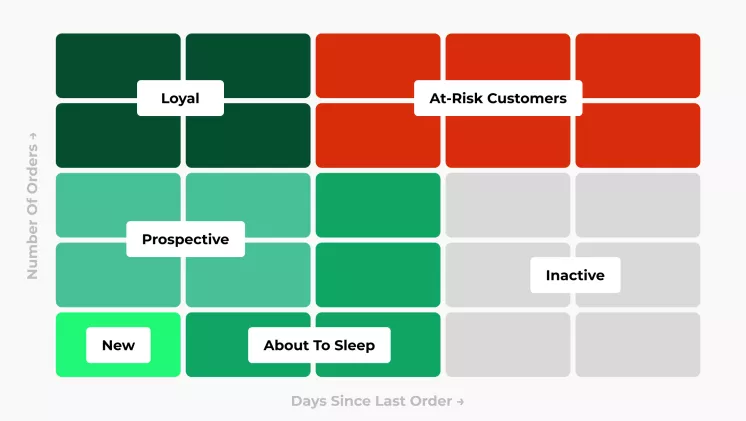
Based on the analysis results, you can independently determine how many customer groups you have. However, we would advise you to divide them as follows:
- Best Customers (or Loyal): Have shopped in the store in the last 30 days and placed 4 or more orders.
- Prospective Customers: Placed 2-3 orders and visited your store at any time in the last 6 months.
- New Customers: Have recently ordered from your store within the last 30 days but only placed 1 order.
- At-risk customers: Customers who visited your store 6-12 months ago.
- Inactive customers: Customers who visited your store more than 12 months ago.
Of course, this distribution is conditional, but it is worth following it. Usually, customers who have become regular bring the most profit. All others need to be transferred to this status.
How to calculate RFM score
-
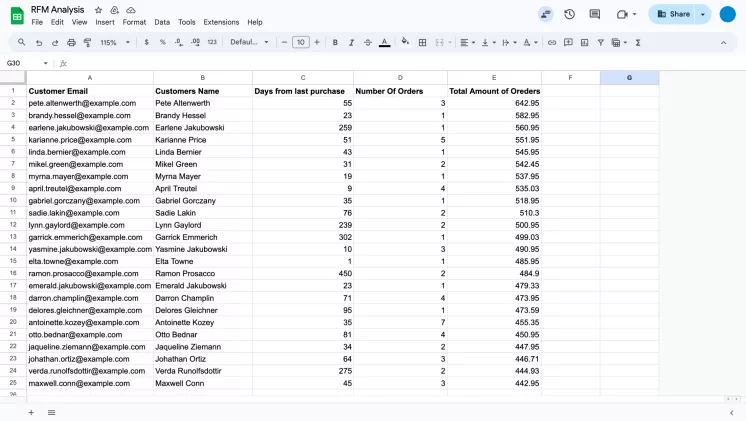
Collect the following data in one table:
- The buyer's name and email
- Total number of orders
- Number of days since the last order
- The cost of all orders together
-
Divide the table into parts for each indicator, sort in descending order, and divide into 4 equal groups of 25% of the total each. Each group receives a score from 1 to 4. For the best group, we put 4; for the worst, we put 1. You can do the opposite. For each group:
Recency:
Frequency:
Monetary value:
-
We compile a list where we indicate the ratings for each customer on each indicator. In the last column, we sum up the obtained values.
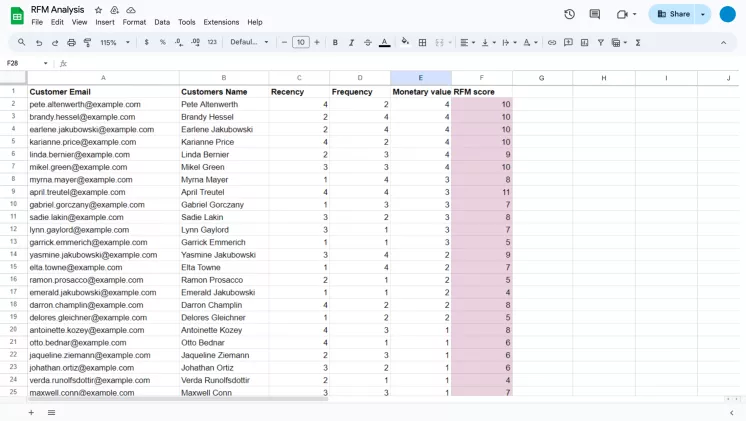
It is also possible not to add up the values but to build three-digit numbers from them. If you need to highlight the value of a certain indicator, put it first. However, this assessment may not always be objective.
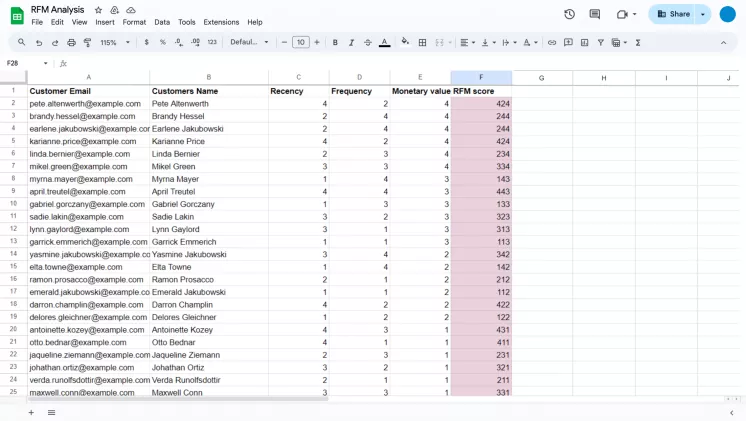
-
Sort the received lists by RFM score.
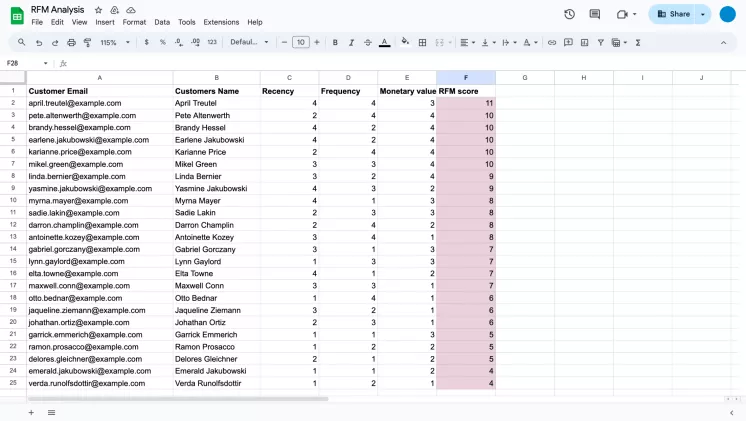
The second option for calculating the summary RFM score:
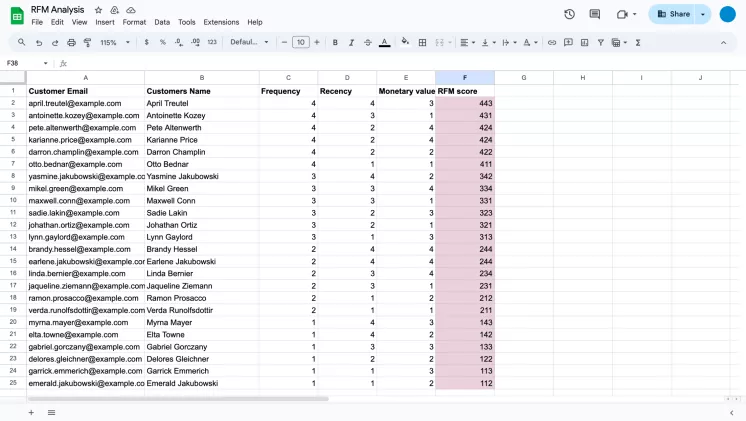
As you can see, the lists are slightly different. This happened because, in the first version, we did not give preference to any indicator. The Frequency indicator was more important for us in the second option. Since its value determined the hundreds of digits in the number, it affected the changes in the list. This should be done only if one of the indicators has more weight for you.
Advice If you choose the second option for calculating the RFM score, we would advise you to put the indicators in the following order: Frequency Recency Monetary value This order will allow us to find new buyers. Since they only bought from you once, they will be at the bottom of the list. Those with a Frequency value of 4 or 3 need your most attention. These people recently purchased from you. Whether they will return will depend on how you further establish contact with these buyers. -
Divide each list into groups: loyal, loyal at risk, potential loyal, new customers, dormant, and at risk.
The first variant of calculations:
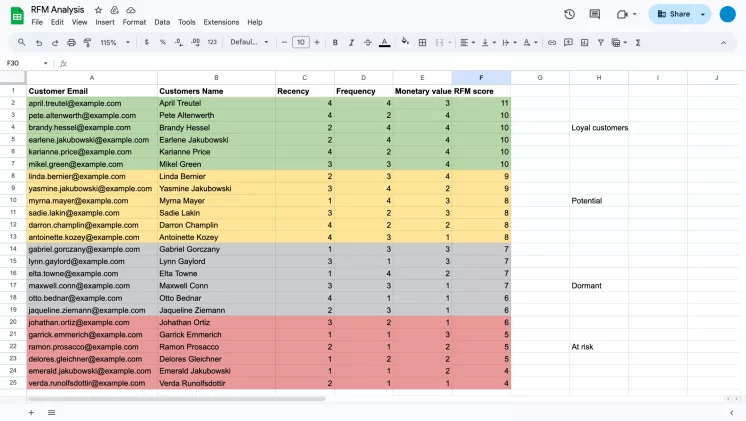
The second variant of calculation:
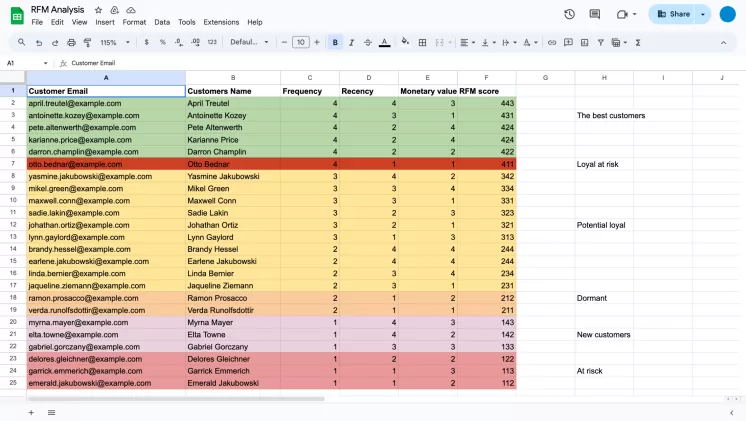
The results clearly show that the second version of the RFM score calculation is much more detailed. This allows you to divide customers into more precise groups and better define their needs.
Using RFM-analysis for Shopify stores
The obtained analysis data have no value if it is not clear how to apply them. Similarly, our article will not have value if we simply say that customer segmentation is very important and useful for any store and end the article on this.
This analysis's main benefit is the ability to divide your buyers into groups. According to this distribution, you can change the approach for each group. This information will be valuable if you do not know how many regular customers you have and why your customers do not return.
For shops on the Shopify platform, RFM analysis helps to clearly understand customer behavior and improve Shopify LTV (customer lifetime value). Based on this, stores can build strategies that increase conversion and optimize advertising costs. The biggest advantage of this approach is the ability to personalize the interaction with each customer segment, thereby increasing their loyalty and long-term value.
Ways of using RFM-analysis results
Individual approach to each group of customers
Develop a special interaction strategy for each customer segment. We advise you to separate those who made their first purchase from you recently into a separate group. These customers need onboarding, a process that will leave pleasant emotions in their memory and encourage them to return to shopping again.
You can implement a system of individual discounts for your best customers. Their purchase history will show their needs, and you could send them reminders that their favorite products will be discounted during a certain period.
For potentially loyal buyers, it is worth offering to join the internal buyer system and showing your regular customers the advantages.
At-risk customers may have forgotten about your store or not fully understand its value. If you run pages on Instagram, Facebook, or another platform, invite them to join. On these pages, you specifically show how to work with your products and where to use them. Sooner or later, these people will remember that you can satisfy their needs.
You can offer the same for inactive customers, but it's also worth reminding them that they bought from you. Then, your customers will remember their emotions and experiences related to your store. If the experience is pleasant, sooner or later, they will want to come back.
General advice
Here are some key ways to apply the results of this analysis:
-
Creation of personalized advertising campaigns
RFM analysis helps determine which customer segments should be offered different types of promotions or discounts. For example:
- Active buyers (those with high Recency, Frequency, and Monetary scores) can receive special offers to encourage even more frequent purchases.
- Customers who haven't bought in a long time (low recency) can get a discount or a reminder about new products.
- Recent customers can be enticed to make repeat purchases through offers based on their most recent orders.
-
Maintaining loyal customers. RFM analytics lets you identify the most loyal customers who regularly buy and bring the most revenue. This makes it possible to pay special attention to them, for example:
- Send them VIP offers.
- Create loyalty programs that reward them for frequent purchases.
-
Reactivation of 'lost' customers. Customers who haven't purchased in a long time can be identified using RFM analysis and targeted to return with promotions or special offers. This may include:
- Store reminder letters.
- Offers that may interest past customers based on their purchase history.
- Optimization of marketing costs. By using RFM segmentation, you can better target your marketing budget. For example, it does not make sense to invest heavily in customers with low Frequency and Monetary, instead it is worth focusing more on loyal customers. This will help increase the effectiveness of advertising campaigns.
- Analysis of the customer life cycle. RFM analysis helps you understand what stage of your customer's life cycle they are in. This allows you to build strategies to retain or return customers, focusing on their purchase cycle. For example, if a client has fallen into a segment with low recency, it is worth focusing efforts on its reactivation.
- Identification of 'star' clients. Customers who demonstrate high performance in all three metrics (Recency, Frequency, Monetary) are the most profitable for your business. Engaging such customers in loyalty programs or offering exclusive offers can further increase their value.
- Segmentation for email marketing. RFM analysis allows you to segment the customer base for personalized email campaigns. For example, cross-selling or new products can be offered to customers with high frequency, and special promotions or gift offers can be offered to customers with low frequency.
Meaning of RFM-analysis for Shopify stores
RFM analysis allows you to provide Shopify stores with a detailed picture of customer behavior. In addition, you can identify key issues that can affect business performance.
RFM analysis results may indicate the following problems:
- Poor Customer Retention: If most of your customers have a low Recency score, this could indicate customer retention issues.
- Low customer activity: If many customers have a low frequency score, this may indicate a lack of motivation for repeat purchases.
- Decrease in Average Check: Low Monetary numbers may indicate that customers are spending less money than they could, which calls for an improved sales strategy.
Benefits of RFM-analysis
Shops that use RFM analysis receive a number of benefits. The main one is the possibility of preventing customer outflow. You have information about the percentage of people who may stop buying. If you choose the right method of contact, you can ensure that customers do not leave.
RFM analysis has other advantages that help improve business results:
- Improving targeted marketing. Thanks to the segmentation of customers based on RFM data, you will be able to set up advertising campaigns more effectively.
- Reducing marketing costs. Because RFM analysis allows you to focus on the most valuable customers, you can avoid spending on mass marketing campaigns that do not bring results. Instead, you invest in the customers who have the most potential.
- Increasing customer loyalty. Personalized approaches based on RFM analysis help increase customer loyalty. Customers who receive special offers and attention from the store are more motivated to continue cooperation.
- Increasing business profitability. By using data and resources more efficiently, stores can achieve better financial results by focusing their efforts on the most profitable customers.
Why Is RFM-Analysis Important in Shopify?
Thanks to RFM analytics, Shopify stores can understand exactly how and when to communicate with customers best. This allows them to avoid mass, ineffective campaigns and focus on the most valuable customers who bring in the main income. In this way, companies can optimize their marketing investments, reducing the cost of advertising campaigns and increasing their effectiveness.
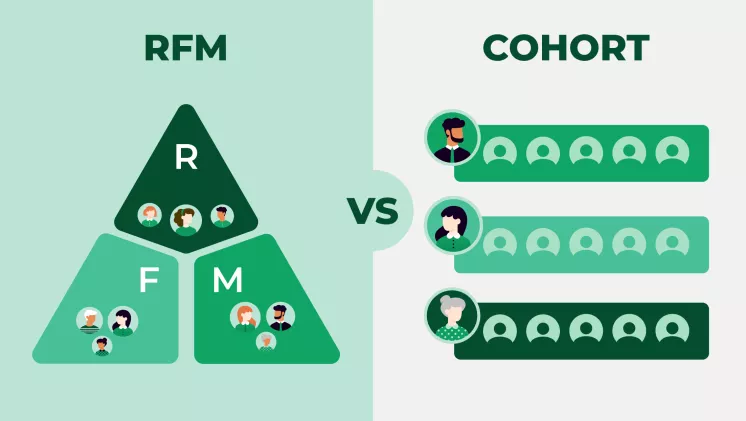
RFM Analytics vs Cohort Analytics
Difference
Although RFM and cohort analysis share the same goal of customer base analysis, they work differently. RFM focuses on the individual behavior of each customer, while cohort analysis analyzes groups of customers who purchased during a certain period. Both approaches can be used together to obtain a comprehensive picture of customer behavior and build a long-term business development strategy.
Сases of use
Each type of analysis has its purpose. There are cases when it is better to use one and sometimes the other.
RFM analysis is useful in the following cases:
- Large customer base: When you have many customers and need to manage their loyalty effectively.
- High marketing costs: If you want to reduce the cost of attracting new customers, and focus on retaining existing ones.
- Low customer loyalty: When customers rarely return to your store and you are looking for ways to improve communication.
- Drop in sales: If you want to understand why customers stop buying and find ways to bring them back with Shopify sales reports.
How to use Mipler RFM Template
At Mipler we've designed the RFM Template to help you segment your customers.
Please follow steps below to add your data there:
- Open Shopify Admin Panel of your store
- Navigate to Analytics > Reports
- Open Sales by Customer Name report
- Add Time > Day column
- Export report
- Make copy of Mipler RFM Template
- Open Sales by Customer Name report on your desktop
- Copy all the data
- Paste it on first tab of a copy of the Mipler RFM Template you made
- On the "Settings" tab, you can check ranges per every segment and update it
- Visit "RFM Analysis" tab to see your customers along with RFM Scores
Conclusion
Your customers are also ordinary people who have their own needs. If you can find these needs and satisfy them, you will have a solid customer base. Using RFM analysis, you can identify customers who are already satisfied with your service.
If a customer likes a store and its products, he will return often, make many purchases, and spend a certain amount of money accordingly. RFM analysis allows us to see precisely this regularity.
You can identify your core customers and focus your efforts on bringing them back. You can also reduce marketing costs. On the other hand, you can also see shortcomings in the form of customer churn.
