Introduction
An online store can have long-term success only if it understands the behavior and needs of its customers. It is important to be able not only to bring a new client but also to keep those who have already come. You don't need a lot of investment to keep a customer. It is much more important to understand the portrait of your buyer.
Shopify customer cohort analysis provides the most clues about customer behavior. It allows you to see the perspective of how your customers behave over time. In addition, this analysis divides them into groups and analyzes each of them separately. You can do different experiments; cohort analysis will show your customers' reactions.
We decided that cohort analysis of customer behavior will become another tool in your store's arsenal. This article will help you understand where you can use this analysis and its advantages. We have created a free Google Sheet template for you so that you can use it immediately.
What is Cohort Analysis?
Cohort analysis is a method of segmenting customers based on certain criteria, such as the time of their first purchase or other key events. Such cohorts include customers who made their first purchase in the same month. By analyzing these cohorts, you can identify patterns in their behavior and understand what factors influence customer behavior.
Cohort analysis should be used when you aim to retain customers, not to attract new ones. This does not mean that you should not attract new customers. But cohort analysis focuses, in particular, on the retention of existing customers.
The analysis shows the number of buyers who made their first purchase in each month of the year. Then, it shows what percentage of them made a repeat purchase and after what time.
How to understand the customer cohort analysis table
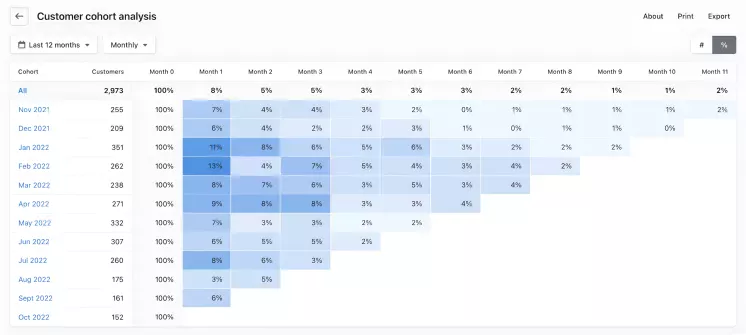
Cohort analysis presents like a table. The main information is in the first column: you see the month of first purchase and the number of customers who made it. The following columns show how many percent of customers returned in the following months. Let's consider an example:
In January 2022, 351 new buyers came.
A month later, i.e. in February 2022, 11% of them made repeat purchases.
That is, 351 * 0,11 = 39 buyers returned
After 2 months, i.e. in March 2022, 8% of buyers returned.
That is, 351 * 0,08 = 28 buyers made repeat purchases.
Why Is Cohort Analysis Important in Shopify?
Cohort analysis is a powerful tool for business optimization on the Shopify platform. Store owners can use it to see how customers behave. For example, if a customer made their first purchase at a certain time, only two options for their behavior are possible: they returned or did not.
You can do some new actions every month: introduce promotions, make a sale, change products, and change the quality of customer support. Then, each group will show how these actions affect your customers. Basically, you can track customer behavior on Shopify.
You can also ask those customers who did not return what they did not like. The main value of cohort analysis is seeing how many people have returned to you. These people are your target audience.
The result will not be immediate; you need to wait several months. For example, an email newsletter can help you encourage customers to buy products from you again or inform them about discounts. What is important is that you can see if your actions were effective.
Benefits of Understanding Customer Retention
Customer retention is one of the key factors in the long-term success of an online store. Customers who regularly return for repeat purchases are much more profitable for a business than attracting new customers. With the help of cohort analysis, entrepreneurs can:
- Identify the most valuable customer cohorts.
- Optimize marketing budgets.
- Improve the level of customer service.
- Create personalized offers for different customer segments.
- Understand how customer behavior changes after the first purchase.
Key Metrics for Cohort Analysis
Cohort analysis is not directly related to performance indicators. But they influence the results and, together with cohort analysis, form a complete picture.
- Customer Retention Rate: This metric indicates the percentage of customers who returned after the first purchase. It is reflected in the cohort analysis. The only thing you need to pay attention to is that this metric is calculated for each month separately and only within the group. You need to calculate the total figure yourself.
- Average Order Value: allows you to analyze how the number of purchases in one cohort changes over time.
- Average Time to Repurchase: shows how much time passes between the first and subsequent purchases.
- Customer Lifetime Value: indicates the customer's total value during his interaction with the store. Shopify LTV is another key metric that helps you better understand the current situation and even predict future sales.
How to Perform a Cohort Analysis in Shopify?
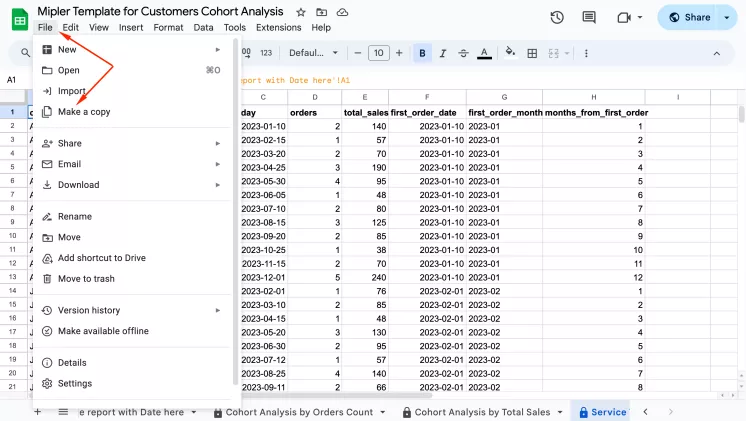
- Make copy of Mipler template:
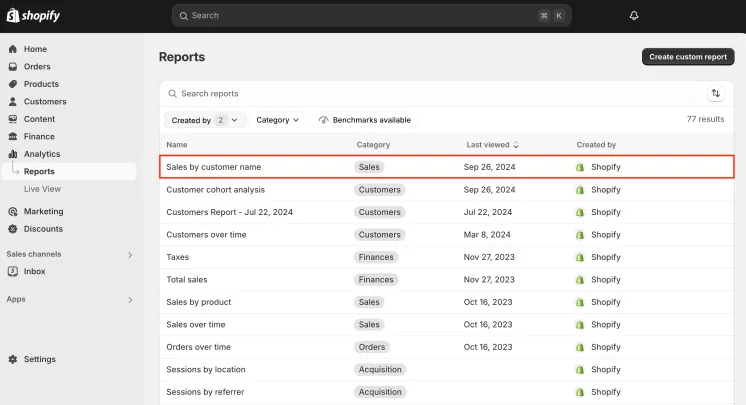
- In Shopify admin panel of your store go to Analytics > Reports:
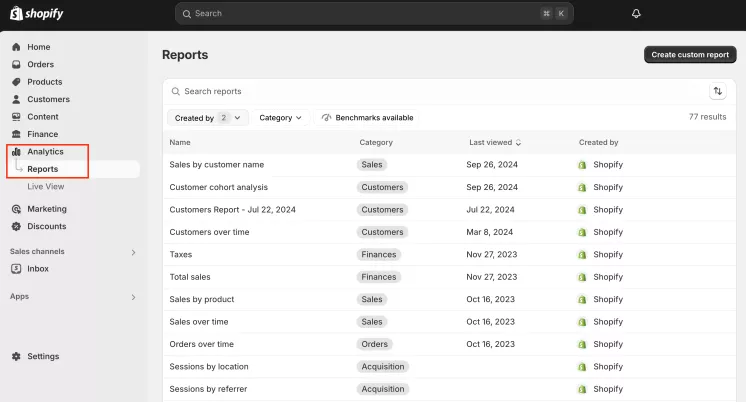
- Find Sales by Customer name report:
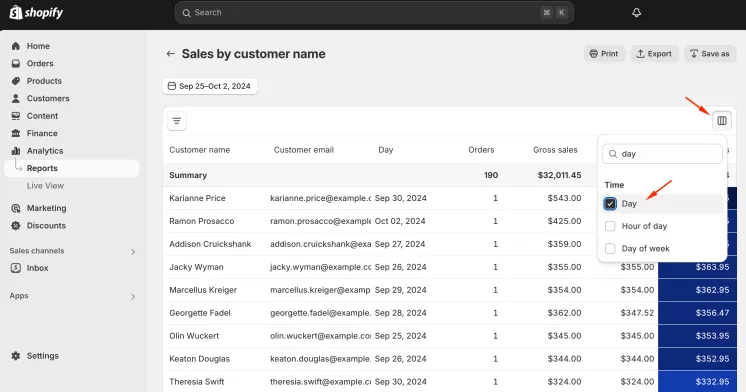
- Now you need to add Time > Day column:
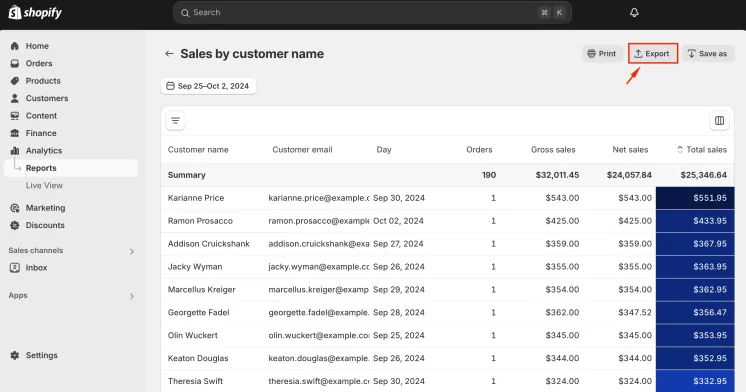
- Export the report:
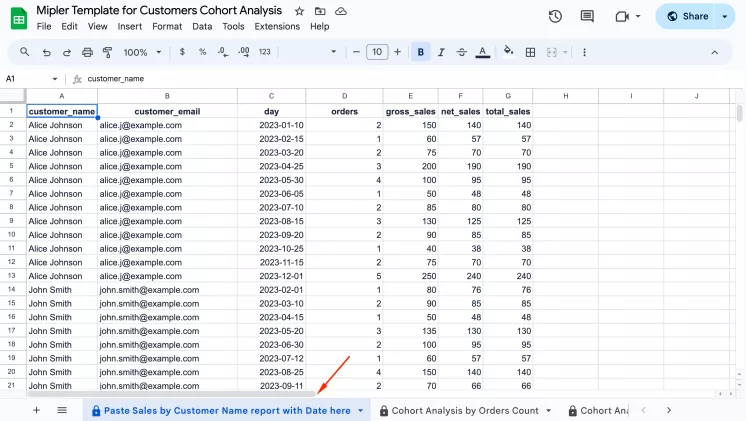
- Then open it on your desktop, copy all the cells and paste it on the first tab of the template:
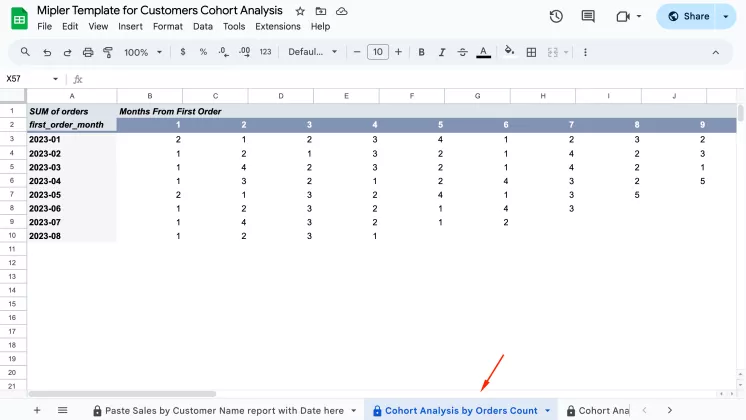
- Now you can check Cohort Reports by number of orders on the second tab.
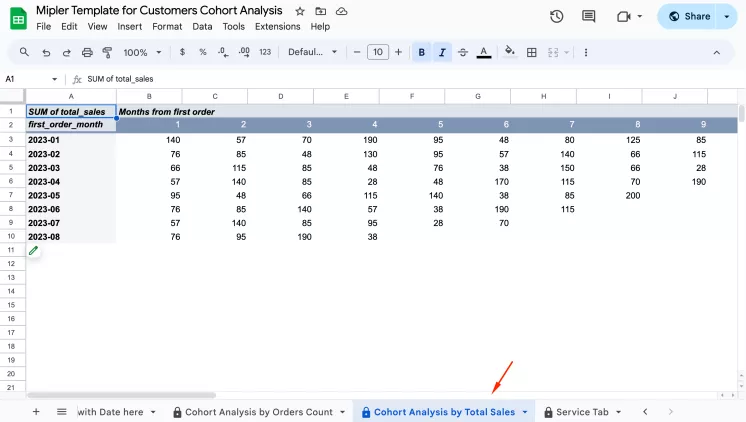
- For Cohort Analysis by total sales instead of number of orders, kindly check third tab:
Additional Tips for Improving Retention Using Cohort Data
Data analytics is effective only when something changes with its help. In addition to analyzing your users' behavior, it is worth changing your approach to communicating with them based on this analysis. It is impossible to immediately guess whether your actions will bring results. We offer small tips that will definitely improve your store's results.
Segmenting Customers Based on Cohort Behavior
Cohort analysis divides your consumers into groups. It is worth using this distribution to approach each of them more personally. First, it is worth determining what wishes, needs, and features each cereal has. These may differ by age or preferences. Having understood your buyer's portrait, you will be able to choose the appropriate approach and products for him.
A simple example is a segment of users who made their first purchase at the end of the year: in October, November, or December. You can infer that they bought gifts before the holidays or for big sales like Black Friday. Accordingly, such buyers will be interested in receiving an invitation to a spring sale or information about gift promotions before Easter.
Tailoring Marketing and Promotions to Specific Cohorts
To communicate effectively with your customers, you should set up advertising and promotions for each cohort separately. In the example above, you can make special offers for different cohorts using email newsletters. The best thing about your customers is that they make their first purchase. Then, they have the first need for your product. You should use this information.
When you make your customers feel valued, they become loyal to your store in particular. Sure, there may be other stores that sell the same products as yours, but they are not you. Your customers won't buy from someone who hasn't made them feel valued like you did.
Automating Reports for Ongoing Retention Tracking
Customer behavior can be difficult to predict unless you use automated reports. Cohort analysis alone will not give you enough information to react quickly to trends.
It is worth using Shopify Sales Reports to understand which products are selling better. Different sales reports will show you which days more products are bought, from which manufacturer, which style, and which are the main characteristics of buyers.
Choose a product that is best bought in the spring and offer a discount to buyers who first came to you in February, March, or April. This will ensure that you offer the right product to the target audience.
Conclusion
First of all, customers who have already become buyers are important and valuable to the store. As a store owner or manager, it's your job to do your best to keep them coming back.
Cohort analysis simply helps to understand when customers come for the first time, for what purpose, and when they make a repeat purchase. With this data, you will always be able to offer everyone what they really need.
If you pay attention to your customers' needs, they will come back to you. This will always work as long as you value your customers and personalize your communication with them. Cohort analysis simply gives you information about their needs.
