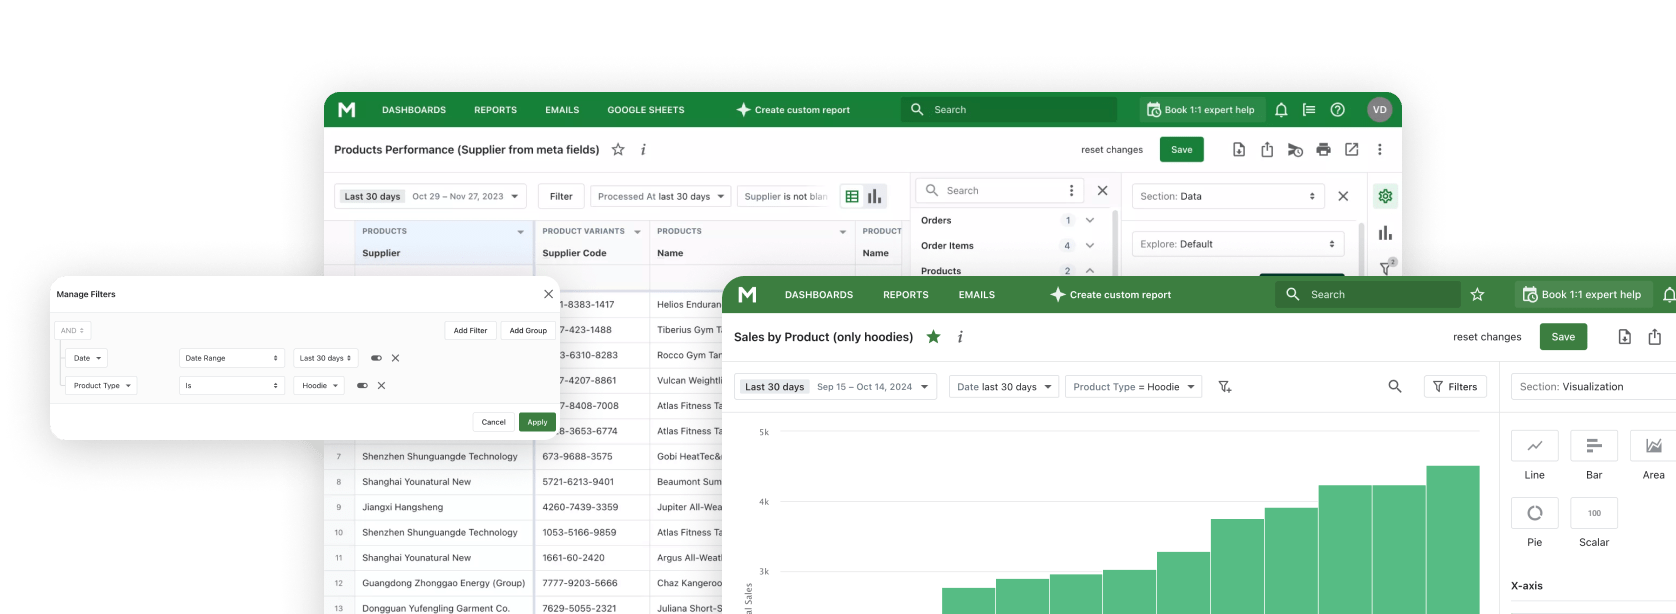
What is the Shopify Sales by Discount Code Report
The Shopify Sales by Discount Code Report provides an analysis of your sales based on the discount codes used by customers. This report helps marketers understand which promotions or campaigns resonate most with their audience and drive significant revenue growth. Among other Shopify Reports, this report directly shows the results of the store's marketing activities.
Why Shopify Sales by Discount report is important
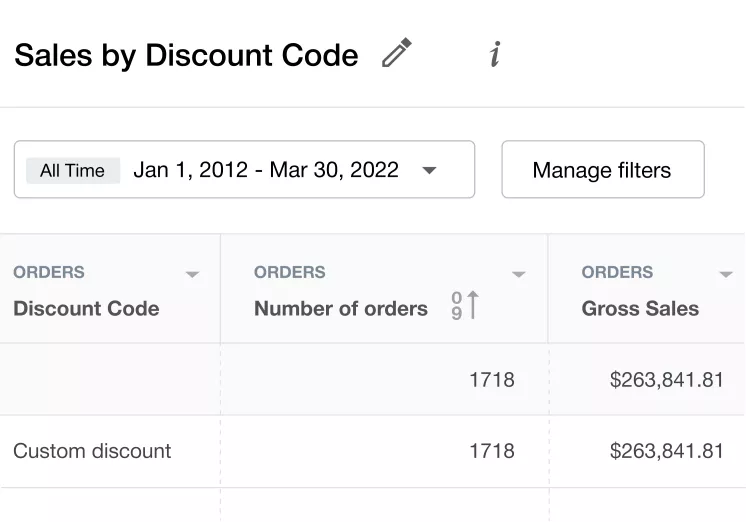
Shopify aggregates coupon data in a clear, organized manner, providing valuable insights into your e-commerce store's performance and enabling you to track the effectiveness of your promotional efforts.
This is done by tracking the usage of the discount codes your store issues for each promo campaign.
With Mipler, you can extend Shopify's reporting functionality (available on the Shopify plan or higher) to any plan and generate a Sales by Discount Code report. This summary shows the breakdown of revenue and expenses for products for each promo code.
Use the functionality of this Shopify reporting app to compare the costs and revenue across different marketing campaigns launched in your store to better understand which one brings the most profits.
Additionally, use the presented summary to get information on the changes in key sales indicators. Easily contrast current data with earlier time periods.
The default configuration of this report offers general sales data split by the discount code that was utilized for each order. You will get figures on the number of transactions, gross sales, returns, discounts, net quantity, and totals for each discount code.
Enhance the clarity of the summary output by applying filters, which help to make the data more representative according to your needs. For example, you can add customer type (new or recurring one), shipping method, fulfillment status, and financial status for orders. Such information can be used when making decisions for future inventory planning and marketing purposes.
How the Shopify Sales by Discount Code Report Helps You
You run various marketing campaigns, organize sales, and send promotional discount codes. The Discount Code report will help you increase the effectiveness of these actions by showing:
- You will see which promo code or discount brought more customers.
- You will also understand what income you received from discounts, how discounts affect sales and profits.
- The report shows the results of the campaign and marketing activities contribute to attracting new customers or increasing repeat purchases.
As with other Shopify Sales Reports, this information allows you to improve your marketing strategy, optimize your campaign spend, and make your discounts more targeted.
What questions summary on sales by discount code can answer
Get a detailed sales breakdown based on the promo codes customers have used for making purchases in your store. This type of summary aggregates information on each coupon that was used within the specific date range chosen for the report generation.
Using the summary on discount codes, the executive managers of the store can receive several benefits. For example, by using reporting apps they can obtain a high-level overview of sales made with coupons.
The document also gives detailed information on each coupon used within the selected time range. The sales data includes key metrics for further analysis, which can be used to answer such questions as:
- What is the number of transactions made with a specific coupon within the specified time period?
- How to see the sum of gross sales that were obtained for each discount code?/li>
- What are the key sales indicators (total, gross, net sales) for each promotional coupon within the given time range?
- How many refunds does each discount coupon have?
- Which coupons are most used by first-time customers?
- What sums of taxes and shipping fees are attributed to each discount code?
Expand this list of answers by extending the report with the help of additional data columns and data filters.
Key sales indicators in a discount report Shopify
Using this summary, get an accurate look at the popularity of discount coupons in a store and determine how each of the issued codes performs.
Furthermore, the store managers can get additional insights by adding more data or filters to the report. Expand the summary with additional columns to get a detailed view.
For example, track which types of customers use the discount codes and what the customer lifetime value is for each coupon.
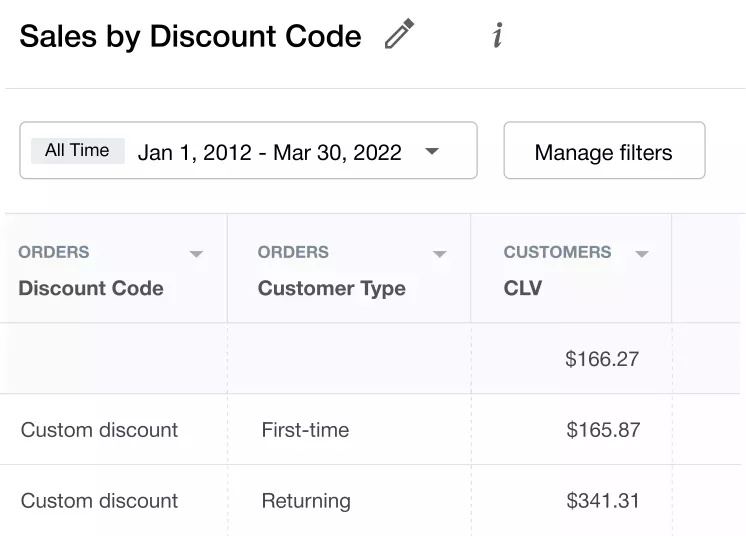
Track the number of transactions, gross and net sales, and item quantities within the chosen time period. Sales overview output for each sales day displays such data as:
- Number of orders
- Gross, Net sales
- Taxes
- Discounts
- Refunds
Use these columns to glance at the current sales situation for each discount code used in your store within the range of selected dates.
Reports similar to Sales by Discount Code
A summary on sales with discount codes is an easy-to-view approach for getting the current status of each promo campaign launched in the store. However, the focus on sales data can be changed to another scope.
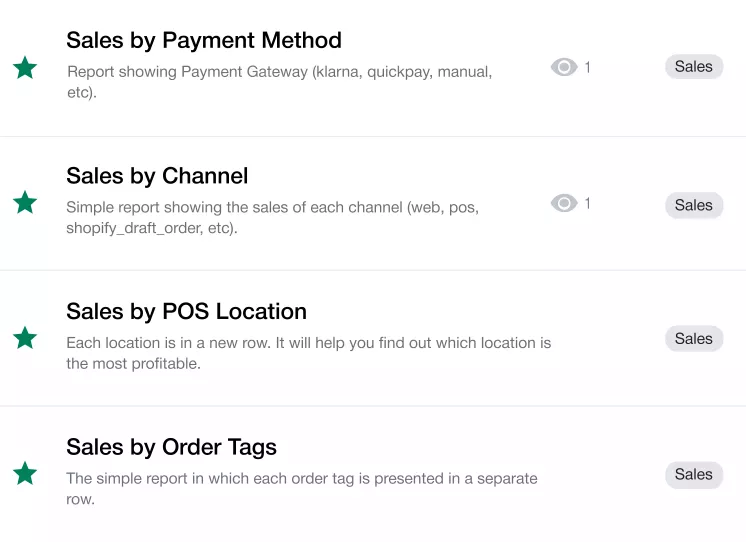
Mipler allow switching time periods and comparing data between selected time ranges. Furthermore, the sales report can be generated based on other factors that can be extracted from the store database.
In conjunction with the variant sales, a store manager can often use such summaries as:
- Sales by Payment Method. Know which payment gateways are most widely used by your shoppers for making purchases. Use this data to enhance the shopping experience for customers.
- Sales by Channel. See what channels bring sales to your store. Get information on whether it is an offline POS or online store.
- Average Order Value Over Time. It shows how the average check has changed over a certain time period, for example, a month.
- Sales by POS location. Find which locations with your store's POS bring you the most profits.
- Sales by Order tags. Analyze sales on meta information of orders – their tags. It is another way to focus on sales.
Key columns for sales by discount code
Typically, the table with data on Shopify sales and discount codes consists of columns such as:
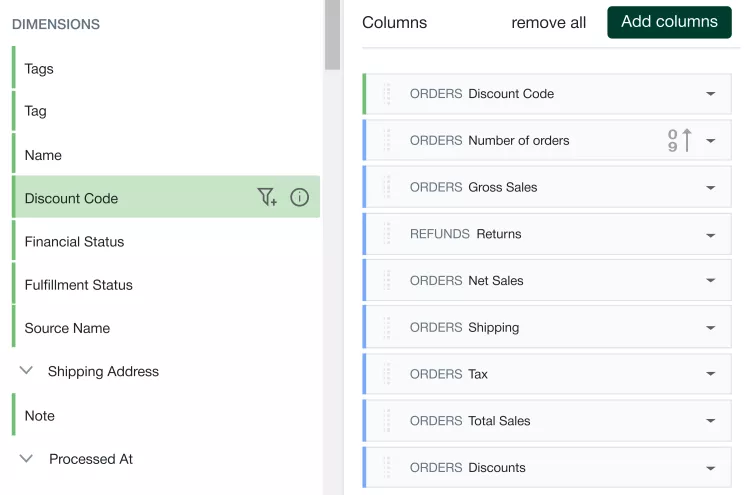
An executive manager responsible for analytics can exclude any of the existing columns from the default configuration or add additional ones. Simply choose available columns from the list.
Here is how some of the key columns in the default report are calculated:
-
ORDER ITEMS Net Sales. The net sales column of the default report is calculated through gross sales, discounts, and refunds of purchased products.
[ORDER ITEMS Net Sales] = [ORDER ITEMS Gross Sales] - [ORDERS Discounts] – [REFUNDS Returns]
-
ORDERS Shipping. The shipping fees are obtained from the total shipping price and amount of purchased products.
[ORDERS Shipping] = [ORDERS Shipping amount] - [ORDER ADJUSTMENTS Total Shipping Amount]
-
ORDER ITEMS Total Sales. Get the sum of total sales calculated as:
[ORDERS Total Sales] = [ORDERS Net Sales] + [ORDERS Shipping] + [ORDERS Tax]
How to run a report on Discount Codes Shopify
Using Mipler Reports:
Mipler makes generating Shopify Sales Reports by Discount Code Report quick and simple. Just follow these steps:
- Open Mipler in your Shopify admin.
- Find the Sales by Discount Code Report in Mipler's library.
- Select your date range (e.g., today, last 7 days, last month, last year).
- Apply filters if needed – display Sales by Discount Code under 24 hours for particular discount codes, gross/net sales or number of orders.
- Run the report to automatically display your sales by discount code data organized. The report displays data metrics for each hour starting from 00:00 to 23:00.
That's it – in a few clicks, you have the detailed Sales by Discount Code.
Running the Discount Codes report in Shopify is a straightforward process that provides clarity on the effectiveness of your promotions.
Using basic Shopify Analytics:
To access valuable insights about your discount codes in Shopify, you'll need to follow a few simple steps within your Shopify admin dashboard:
- Log In to Your Shopify Admin Dashboard
- Access the 'Analytics' Tab
- Select 'Reports'
- Choose 'Discount Codes' as Your Report Type
Keep in mind that basic Shopify Reports come with limitations in features, filters, and automation. This can make it more time-consuming to set up reports correctly, and in some cases, certain functions may not be available at all.
Variations of Sales by Discount Code Shopify Reports
You can get another view on purchases besides viewing the default discount sales data. Using variations of the basic report, a store manager can obtain clearer insights into the online business's performance.
Comparing a specific date range to a previous period is one of the easiest ways to assess business performance.
Use the filters and sorting options the app provides to expand reporting capabilities and get answers to other questions regarding sales. Here are a few examples of the basic report variations.
How to see discount sales by location
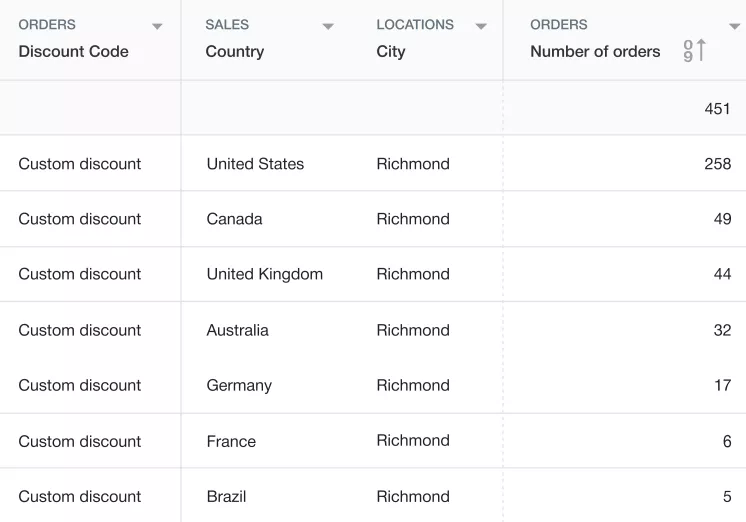
You can easily see the purchase data for each discount coupon with data on the geographical distribution of customers and the number of transactions.
See what provinces, cities, and countries you have the most or least purchases.
How to see customer's lifetime value
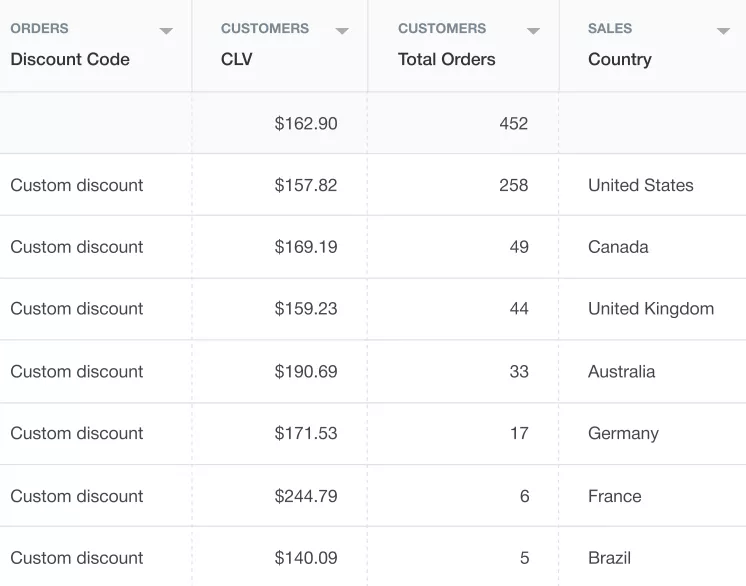
It is well known that existing customers cost less than attracting new ones for a store. Depending on the purchases each customer makes, they set their individual value for a store.
You can easily see the customer lifetime value with the CUSTOMERS CLV data column. Use it to monitor for signs of shoppers' attrition in your store.
Make the purchase picture clearer by adding a column that shows the total number of transactions for each discount code.
How to see gross margin in percent
Gross margin is one of the parameters for the business performance, which shows how much financial funds the store retains. The higher this indicator is, the more capital is available to pay for other costs.
See the gross margin in percent by activating a corresponding column.
[ORDERS Gross Margin, %] = ([ORDERS Net Sales] - [ORDERS COGS]) ÷ [ORDERS Net Sales] × 100
The result is rounded to two numbers after the comma sign. If the calculation result is negative, the report shows zero value in the table.
How to see the total cost of purchased products
The total cost of ordered products in the order is calculated as:
[ORDER ITEMS Total Cost] = [ORDER ITEMS Quantity] × [INVENTORY ITEMS Cost]
How to see what type of customer made the order
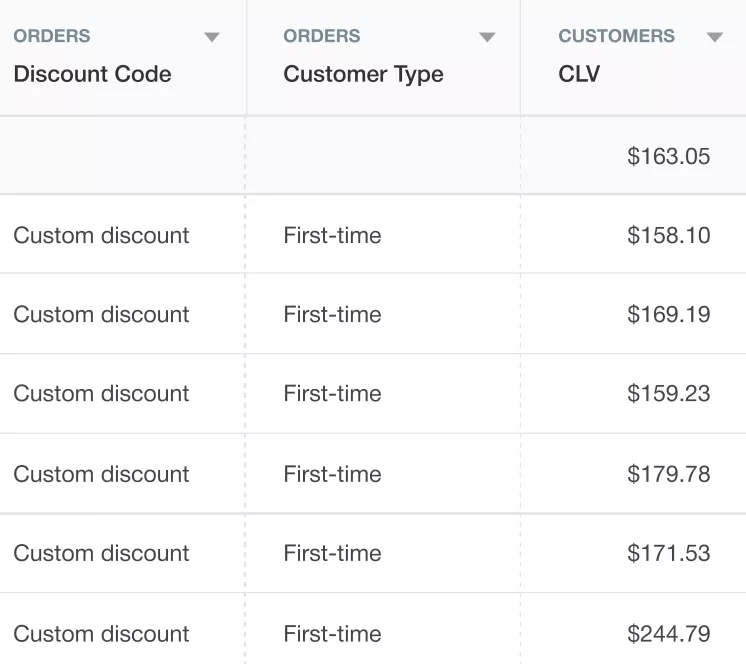
A store can have both new and recurring customers, the latter being preferable. Merchants can easily see what types of customers buy in their stores within the ORDERS Customer Type column.
In case the date of the customer's first order is equal to the order processing date, then the customer is considered a first-time buyer. Otherwise, they are assigned to a Returning type. If the report cannot detect the customer ID, it will display the Unknown value.
How to get total sales for orders
Get the sum of total sales calculated as:
[ORDERS Total Sales] = [ORDERS Net Sales] + [ORDERS Shipping] + [ORDERS Tax]
The ORDERS Net Sales are obtained as:
[ORDERS Net Sales] = [ORDERS Gross Amount] - [ORDERS Discounts] - [REFUNDS Returns]
The ORDERS Shipping is obtained as:
[ORDERS Shipping] = [ORDERS Shipping amount] - [ORDER ADJUSTMENTS Total Shipping Amount]
The ORDERS Shipping is obtained as:
[ORDERS Tax] = [ORDERS Taxes] – [REFUND ITEMS Total Tax Amount]
Create Shopify Sales by Discount Code Report with Mipler
Mipler offers a ready-to-use Sales by Discount Code Report. Of course, every business has its own needs, so you can easily customize and improve the Shopify discounts report in the following ways:
- Add additional columns to display other information you need.
- Apply new filters. You can increase the range of dates, display only successful discount codes in your opinion, and simply refine the report data.
- Export the report to Google Sheets for further analysis, such as performing complex calculations or integrating additional data.
If you need help with updates or settings, our support team is always ready to help!
FAQ
What is the Shopify Sales by Discount Code Report?
It is a report that groups sales data by product collections, helping you analyze and compare the performance of different collections in your store.
How will this report be useful for my store?
The Sales by Discount Code Report can give you the following information:
- You will see the profitability of each coupon during the specified time period.
- The amount of gross sales received for each discount code will be displayed
- It will be possible to determine the popularity of coupons.
- You will see key sales figures (total, gross, net sales) for each promotional coupon
What are the options for using the Sales by Discount Code Report?
You can add new columns to the report and analyze:
- discount sales by location
- customer's lifetime value
- gross margin in percent
- total cost of purchased products
- type of customer made the order
- total sales for orders
How to make working with the report more convenient?
- Add new columns to get more detailed information.
- Add new filters to display the information you need.
- Export the report to Google Sheets
- Contact our support service.
