It’s hard to fit every business into one schema. It’s easier to provide the ability to bring your own unique features into the reporting and applications your store uses. Order line item properties are designed just for that. Custom engraving, food allergies, T-shirt lettering, custom sizing, shipping options - all of these can be specified in Shopify Reports or a spreadsheet using order item properties.
Why Shopify Order Line Item Property Reports are Important
The main goal of Shopify line item properties is to help make the information about each product in an order as customizable and user-friendly as possible. There’s no other way to do this. Metafields provide customization to the entire order, rather than each order line item individually.
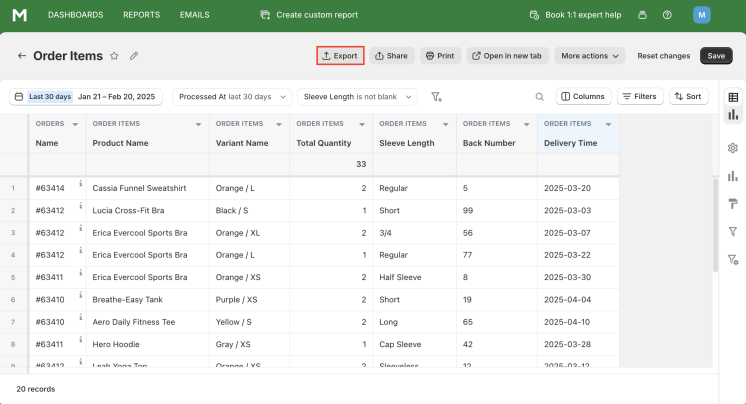
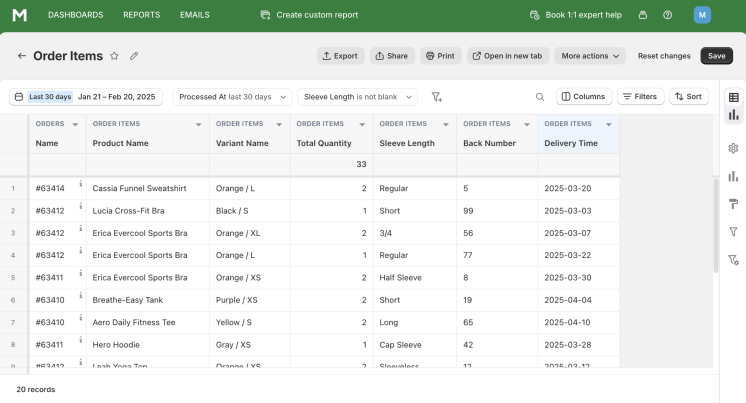
Unlike many of our articles, this article will not describe a separate report, but a separate column. It is most convenient to use this custom column in the Order Items report. You immediately see the special requirements for each product in the order. However, no one forbids using this column in other reports. The main thing is that it is convenient for you.
You may not consider this property important, but then you may lose valuable customers. Special wishes of customers, reflected using Shopify line item properties, will become a good basis for building strong relationships with your customers.
Benefits of Shopify Reports by Order Line Item Properties
The benefits for store owners of using Reports by Order Line Item Properties are as follows:
- The most important benefit for you and your store is the possibility to understand individual wishes of your buyers and by fulfilling them, you create a reliable base of regular customers;
- You can see trends in demand and pre-order inventory to meet your orders on time. This is especially significant if you need to manually customize customer requests. For example, if your business makes personalized T-shirts, you will likely see an increase in orders for the movie characters on those T-shirts after a new popular movie is released;
- Order Line Item Properties allows you to keep all requests as notes to the order, so you don't have to create a separate report for them.
How the Reports by Order Line Item Properties in Shopify Helps You
Using a report that will apply to each product in the order will help you when packaging this order. And in general, it is convenient when all the data is in one place. And if you also add the Line Item Properties column, then you will get additional features.
Using this custom column will help you plan your store operations. If individual requests in an order need to be fulfilled manually, you can estimate the execution time and the number of employees involved. If the request concerns sleeve length, back number or delivery features, you can see this in the general list and estimate how long it will take to fulfill the requirements.
Here's another life hack. Just like in Shopify Sales Reports, you can determine the popularity of certain personal queries by the number of repeat queries in orders. Pay attention to what customers order again and make it your feature.
Create Shopify Reports by Order Line Item Properties with Mipler
Line item properties allow you to store special information about your products or customer preferences. These properties are stored as an array of key-value pairs in each order line:
[{key: value}, {key: value}...]
However, when it comes to generating reports or exporting data from your Shopify store, you may find that accessing certain property values can be a bit tricky. This is because the properties are stored as an array and you need to use special functions to get a specific value.
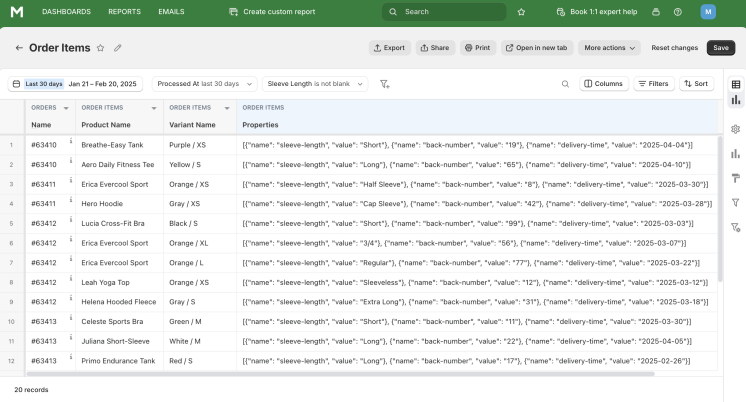
To generate a report using a specific property value, you need to create a column for each required property.
For example, if you want to create a report that contains the "Student Name" and "Teacher Name" properties, you need to create two separate columns before using those columns in the report.
Let's say you have three properties: sleeve length, back number, and delivery time. These properties are stored as an array:
            [
                {"name": "sleeve-length", "value": "Short"},
                {"name": "back-number", "value": "19"},
                {"name": "delivery-time", "value": "2025-04-04"}
            ]
If you want to get the value of the "Sleeve length" property, you can use the JSONPATH function:
JSONPATH(order_items.properties, "#(name=""sleeve-length"").value")
Back number:
JSONPATH(order_items.properties, "#(name=""back-number"").value")
Delivery Time:
DATEVALUE(JSONPATH(order_items.properties, "#(name=""delivery-time"").value"))
As you can see, we used the DATEVALUE function to convert the string value returned by the JSONPATH function to a date value. This conversion is especially useful when filtering data by time using a calendar.
Automate Shopify Order Line Item Properties Reports for Store Optimization
Process automation should reduce the burden on managers and employees and save them time. Mipler has solved this issue in several ways. Our goal was to make it easier for you to access the necessary reports and work with them, as well as take away some burden of additional calculations and information processing.
So that you don’t have to look for the necessary reports in the application every morning, you can set up scheduled email reports. All settings are individual. You determine how many times a day you will receive emails with data, select the reports you want to view;
Access to reports in the application is limited to a select group of people who have access. If you want everyone to have access to a report, you can upload it to Google Sheets. Then you can make changes to the report and have access to it for many people;
Some calculations that you want to do can also be performed in our application. Sometimes it’s enough to add a column, or our team can develop a custom one for your needs.
Important
While you’re trying to fulfill customer orders as accurately as possible, it’s important to take care of your own ease of working with those orders. Line item properties in Shopify help you understand exactly what your customer wants and what features each item should have.
And the Reports by Order Line Item Property help you easily process requests, plan packaging, and monitor the situation with just one document. Mipler has included this custom column in its basic reports. Save yourself time by using this automatic document.
FAQ
What are Shopify Order Line Item Properties?
Shopify line item properties are special fields in which you can write additional customer wishes or parameters about each product in the order.
How Shopify Line Item Properties can help store owners?
Order Line Item Properties helps you see and implement individual customer wishes. This will increase their loyalty to the store and increase the number of customers.
How can Mipler help to work with Shopify line item properties?
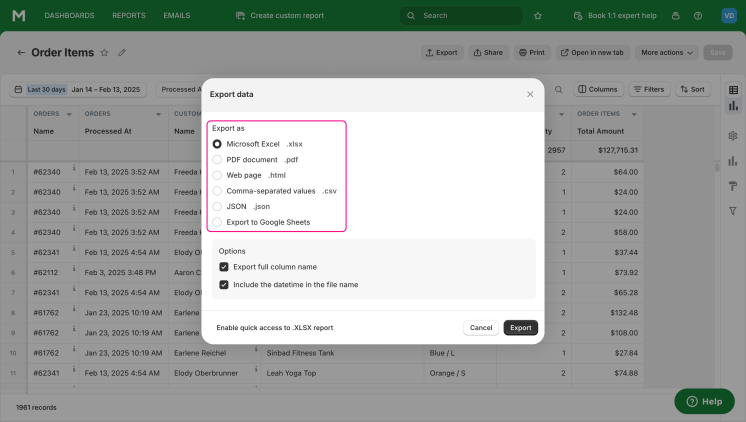
Add this custom column to any report you find convenient. Then you can filter, sort and analyze the properties of order items using this report. You can also download this report in .xlsx, .pdf, .html, .json and .csv formats or upload it to Google Sheets.
How to get Reports by Order Line Item Properties from Mipler app?
- Open any Report you need;
- Add custom column like in example above;
- Save changes;
- Choose “Export” button:
- Choose file format to download report:
