A significant portion of the capital that a store holds is its inventory. To understand how much this will be in monetary terms, it is worth estimating the value of this inventory. Inventory value reports provide you with precise quantitative information about the products and variants available in your locations (warehouses).
The value of the inventory available in your warehouses at the time of the report is calculated. This way, you can see how much capital you currently hold in the form of goods. The Inventory Value Report can also provide information at the end of the month or at the end of the day. This way, you can estimate the turnover of your inventory over different periods of time.
Why the Shopify Inventory Value Report is Important
The financial impact of your inventory on your store is significant. The importance of the Shopify Inventory Value Report can be understood by examining which areas of your store can be managed using its data:
- Financial planning and budgeting: Knowing the value of your inventory, you can assess the profitability of your business, forecast expenses, and plan additional budgeting for purchases.
- Inventory management: Reassessing the importance of products and analyzing their value will help you determine which products are more desirable for purchases and organize your warehouse space. It also helps to avoid inventory obsolescence, stagnation of turnover, and dead stock.
- Cash flow: Using the inventory value report data, you can determine whether cash capital is being held in inventory
- Pricing policy: The price of your products on the site depends on the value of your inventory. If certain products are not selling well, you may want to adjust your pricing policy.
Benefits of the Shopify Inventory Value Report
Reporting in general allows a business to better understand its capabilities, set realistic goals, and analyze results. If you are passionate about estimating the value of inventory, then Inventory Value Report for Shopify store allows you to not only understand and know your inventory. You will be able to:
- Conduct accurate financial planning. You know your budget. You know how much capital is invested in your products, so you can very accurately predict the company's profit, future expenses for the next batch of products, and accordingly plan marketing expenses, personnel payments, and related losses.
- Increase profit margins. By identifying those products that sell better, you can reduce purchases of unpopular products and increase profits by selling popular ones.
- Reduce inventory maintenance costs. By avoiding excessive purchases of unpopular products, you can minimize storage, processing, and packaging costs.
How the Shopify Inventory Value Report Helps You
Reports in general allow you to structure information. In the case when you work in the field of e-commerce, reports are the only way to see the real state of all processes. Your warehouses are far away, and calculating the value of inventory manually is almost impossible. Therefore, Inventory Value Report does it for you. It also aids in:
- Analyzing the sales performance of each product variant;
- Determining excess or shortage of inventory;
- Understanding trends in customer demand and seasonality of sales;
- Making purchasing decisions, financing inventory maintenance, pricing products.
Create a Shopify Inventory Value Report with Mipler
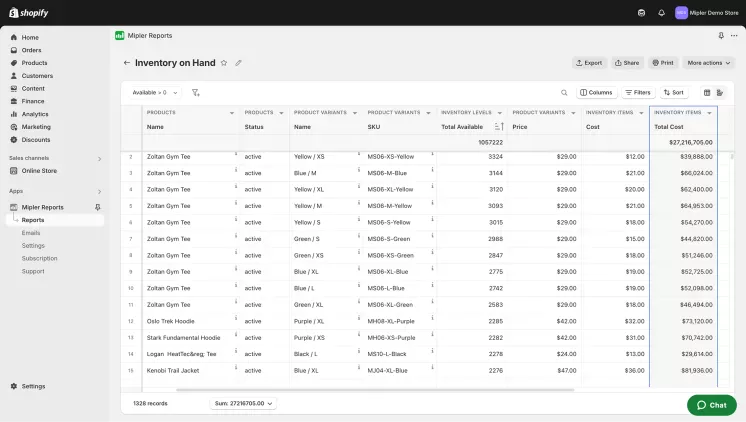
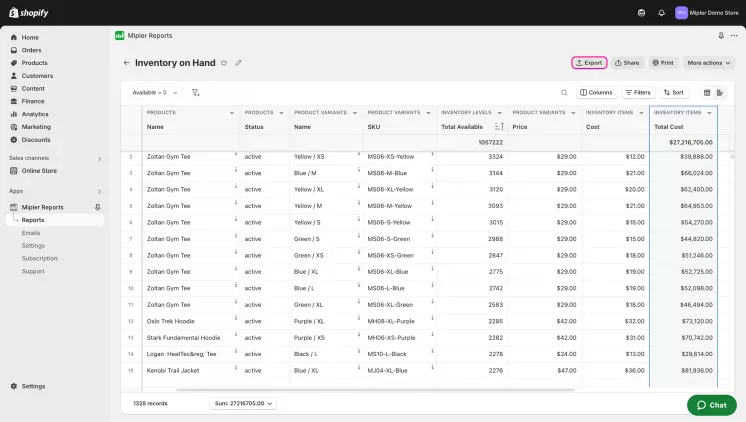
Mipler has already developed an Inventory Value Report. To make it clear that this is the value of the inventory on hand at the time of viewing the information, the report is called Inventory on Hand Report.
When you open this document, you will see the following data:
- Vendor;
- Product Name;
- Product Status;
- Product Variant Name;
- Product SKU;
- Total Available Quantity;
- Price;
- Cost;
- Total Price;
- Total Cost;
- Location Names.
There are also Shopify Reports that provide information about inventory. In them, you can see not only the value of inventory, but also predict the number of purchases or evaluate your inventory according to different criteria.
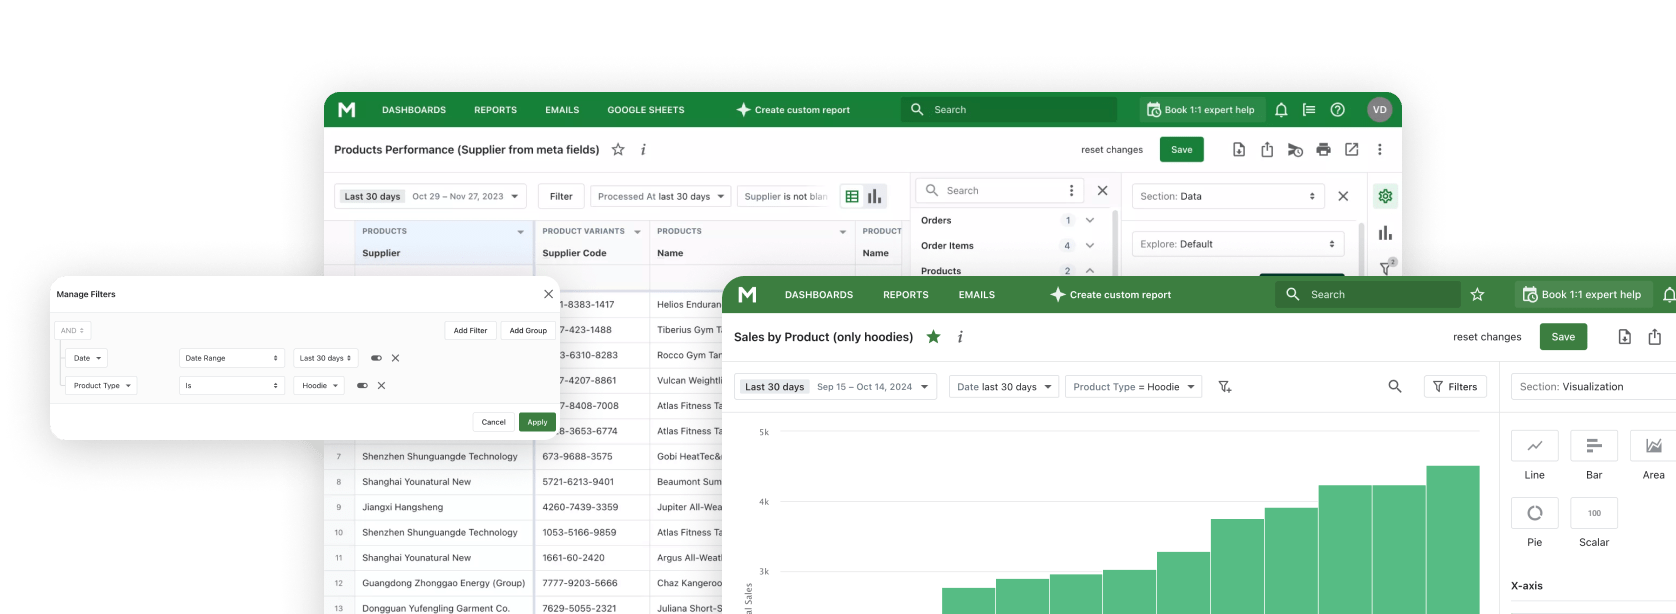
Of course, there may be times when you need to add information to the report. Then you can very easily apply a filter or add an existing column. If the existing tools are not enough, you can create a custom column. Or contact our support team to develop a full-fledged custom report.
Inventory Value Report Examples
Below, we present various inventory value reports that can be generated in Shopify or with our app. In addition to built-in Shopify Inventory Reports, you can build custom reports with your own columns and filters.
Common Inventory Value Report
An inventory value report (also known as Inventory on Hand) shows the cost and quantity of inventory at this moment. The report typically includes the total value of all items in inventory, with a breakdown by SKU.
Inventory value reports are used to track inventory performance and to make decisions about inventory management (increase or reduce stock).
Inventory Value Report by Location
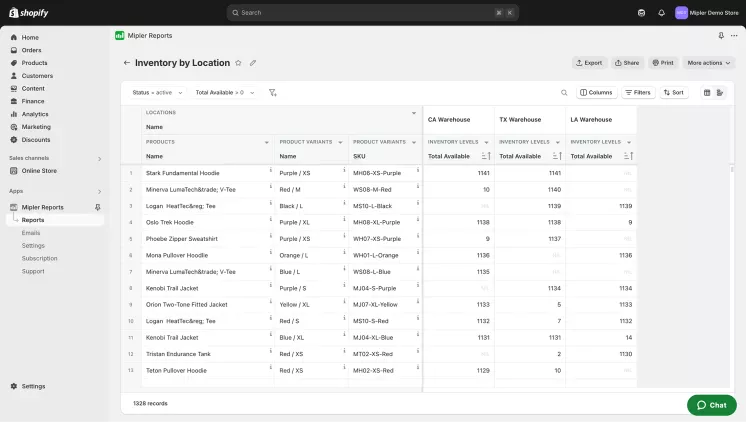
Inventory value by location is a report in the Mipler app, along with over 10 other built-in inventory reports.
| Locations Name | Products Count | Product Variants Count | Inventory Levels Total Available | Inventory Items Total Cost |
|---|---|---|---|---|
| 3400 Richmond Pkwy #2124 | 24 | 141 | 811 | $38,918.00 |
| 241 New Jersey Rd, NJ 08030 | 85 | 443 | 87 | $12,718.70 |
| 109 | 584 | 898 | $51,636.70 |
Inventory Value Report with a Pivot by Location
Inventory by Location report provides a detailed analysis of your Shopify inventory value, broken down by location. By pivoting the data by location, you can gain insights into how inventory splitter by location in an easy-to-read view.
Inventory value report by Vendor
| ProductsVendor | Inventory LevelsTotal Available | Inventory ItemsCost | Inventory ItemsTotal Cost |
|---|---|---|---|
| Hugo | 671 | $58.00 | $38,918.00 |
| Arma | 460 | $58.00 | $26,680.00 |
| Simo&Raim | 12 | $17.00 | $204.00 |
| 729 | $65,802.00 |
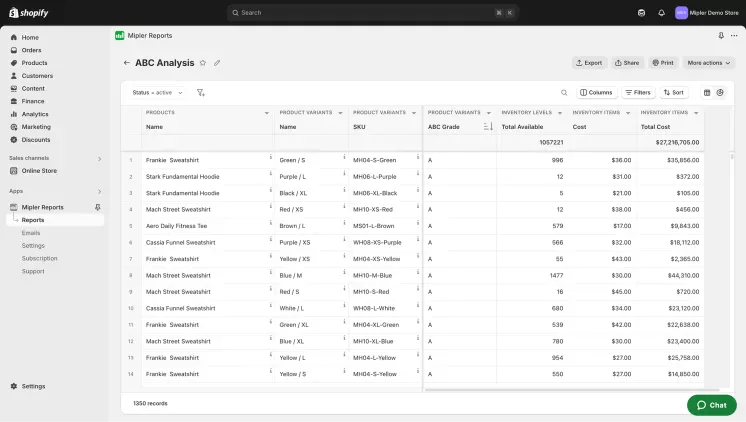
Inventory value report by ABC class
Automate Your Shopify Inventory Value Reports to Optimize Your Store
Automating work with reports is fashionable in different ways. Mipler can offer you to automate your team's work with reports first. Download them as Google Sheets. Then all colleagues to whom you send the link will have access to these files.
To make it easier to control your data, you can set up and use scheduled email newsletters with the latest data. You decide which reports sending and how often.
If you go a little lower in terms of data management, you can use additional custom columns or set up filters to automate calculations within the report. You can also always contact our support team to develop a completely new custom report on the size of your inventory.
Important
Inventory value reporting is an important part of not only your inventory management. Your inventory has a significant impact on finances, taxation, cash flow, budget planning, pricing. It is very important to use the data obtained correctly, analyze it and make financially profitable decisions.
FAQ
What are the Shopify Reports on Inventory Value?
Mipler has developed several reports that can help estimate the value of your inventory based on various criteria:
- Common Inventory Value Report
- Inventory Value Report by Location
- Inventory Value Report by Vendor
- Inventory Value Report by ABC class
What is Inventory Value Report?
Inventory value reports provide you with precise quantitative information about the products and variants available in your locations (warehouses). Unlike other inventory reports, the inventory value report is based only on actual stock quantities on a date:
- Month-end inventory value
- Day-end inventory value
- Current inventory value (inventory on hand), and so on.
How can I use the Inventory Value Report to reduce dead inventory?
Identify slow-selling products. Develop a system of discounts and promotions to sell old inventory. Pair unpopular products with popular ones. Offer a discount when purchasing such a pair of products.
How can I export Shopify Inventory Value Report from Mipler?
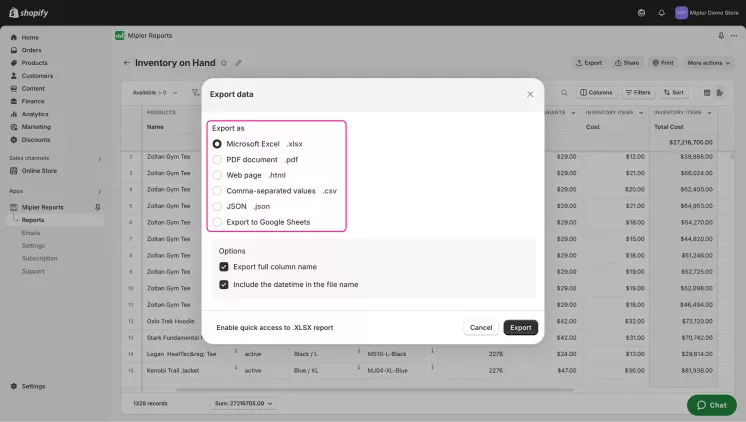
- Open Inventory on Hand Report
- Choose "Export" button:
- Choose file format to download report:
