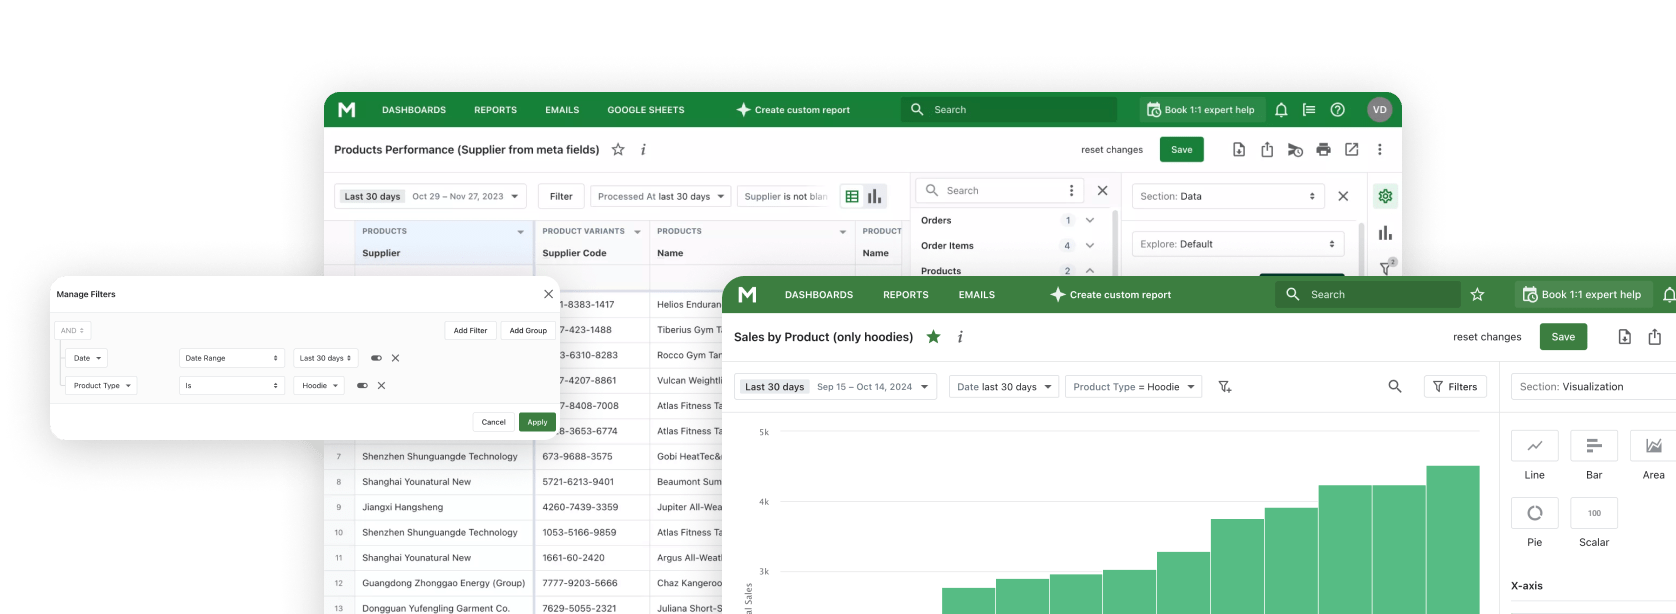
Inventory management for Shopify stores means structure in warehouse and availability of the right product at the right time. A store cannot function without effective inventory management. Inventory reports help you always have up-to-date information about products.
You will be able to purchase the necessary products on time, avoid unnecessary costs, and analyze products according to sales efficiency.
Why Are Shopify Inventory Reports Important?
It is clear that inventory management on Shopify is given a lot of attention. Your inventory is the lifeblood of your store; without it, the store cannot function. Stocks must be updated all the time, and for this, you must always know which goods and how much to buy.
This is the value of inventory management reporting. You can prevent the problem of shortage, absence, or overabundance of goods. You will always know which products are in stock, in which warehouse, from which manufacturer, and when they need to be updated.
If you not only look at the numbers but also analyze them, then the inventory reports will also show how well your goods are sold, from which manufacturers the buyers like the goods more.
If you have enough sales data for analyzing purchasing trends and inventory history, you can predict demand and replenish stocks on time.
Turn Unified Shopify Inventory Report Data into Real Opportunities
The advantages of using Shopify inventory reports described above open up new opportunities for stores. It is important not only to be able to read the data and understand what it shows. To grow successfully, you need to learn how to use this data to make strategic decisions. Inventory management with Shopify will help you:
- Optimize the level of stocks: With the Shopify Inventory on Hand Report, you can estimate the amount of inventory that is in stock and avoid excesses or shortages. But if you additionally use data on days of inventory on hand, you can find a balance between supply and demand, avoiding freezing of capital.
- Setting reorder points: Reorder point allows you to determine the optimal moment for stock replenishment. You eliminate the need for constant inventory control and the threat of product shortages in the warehouse. For seasonal products, this indicator is critical. If a product is a huge success, predicting demand is difficult. Setting a reorder point will remind you when to replenish stocks.
- Estimation of the value of stocks: Inventory valuation provides insight into how much capital is frozen in inventory. It is useful for budget planning and cost reduction due to storage of unpopular goods. The Shopify Inventory Value Report by Mipler not only shows the total inventory value but also allows you to segment it by category or period.
Create Shopify Inventory Reports with Mipler
Shopify inventory management integration with Google Sheets
Mipler enables to integrate Shopify with Google Sheets integration to automatically export products (variants) with available stock quantity, velocity or any other columns to Google Sheets in near real-time.
Automate Your Shopify Inventory Reports
Third-party applications that help manage Shopify store inventory allow you to automate many processes. It is enough to set the necessary filters and add calculated fields, then you will receive a report in which all calculations are performed automatically.
It is also fashionable to set up automatic sending of reports to e-mail. Every morning or every Monday you will be informed about the changes that have taken place in the warehouse. It is also worth allowing to send out monthly and annual reports; then you will see the dynamics of the growth of your stocks.
The Mipler reporting app provides you with plenty of customization opportunities so that you can adjust what types of inventory reports you need and what parameters to include in each one.
Shopify Reports for Inventory – What’s Available with Mipler
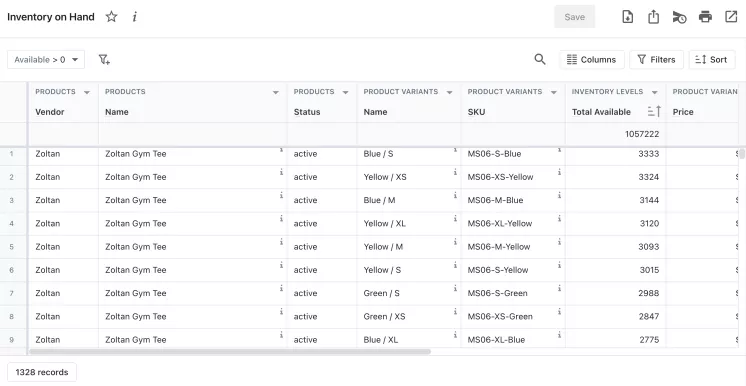
Inventory on-hand
This report will show you how many items you currently have in stock. The following parameters are important in the report:
- Current number of products and product variants (in general or by location).
- Items allocated for packing and shipping.
- How many times each item was sold and replenished during a given time period.
- In which warehouse goods are located.
Inventory history
Shopify's inventory history reports show inventory data over a period of time. You can set the time frame yourself. Historical data may include the following indicators:
- Number of products at the beginning and end.
- Inventory cost.
- The price you set for the sale.
- Stock movement: the receipt and withdrawal of quantities over a period of time.
Inventory by location
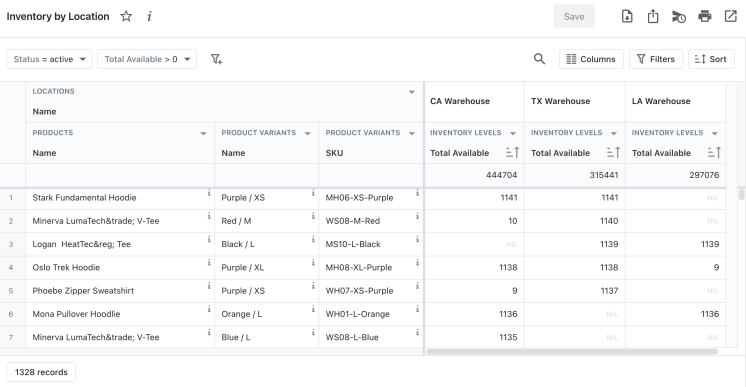
This report is very useful for large stores that have warehouses in different cities. All data are grouped according to the warehouse where the product is located. It is indicated:
- The quantity of goods in each warehouse separately.
- Product.
- Product variant.
The construction of logistics connections depends on the growth of your stocks. Therefore, if you see that products are updated faster in one warehouse, then it is worth distributing products between warehouses so that they are placed closer to your customers.
Inventory value
You will need this report to evaluate overall business operations and prepare period-end financial statements. You can identify the most popular and worst items, their price and retail value. It can also highlight SKU profitability dynamics based on margin level, inventory turnover ratio, and other parameters.
Inventory forecasting and planning
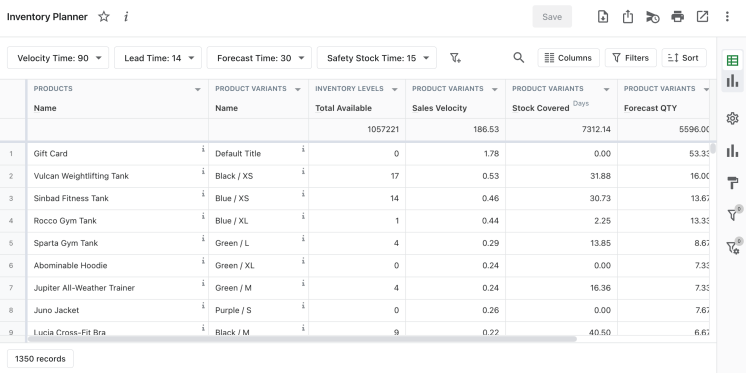
The purpose of such reports is to forecast customer demand based on existing purchasing trends, your inventory history, and sales dynamics. The schedule for purchasing new goods depends on demand. Shopify Inventory planner report can ensure that you minimize your costs of purchasing goods, avoid the situation where there is not enough product, or when it is too much.
Low-stock products
Inventory management report is mandatory if you do not want to have unpleasant surprises. Demand can grow unpredictably, so it is worth checking from time to time which goods are in short supply and whether they are already being delivered to the warehouse.
The minimum number of products that must be in stock is set. The report displays products whose stock levels are lower than normal. This information will help you to replenish stocks in time and adjust plans in general.
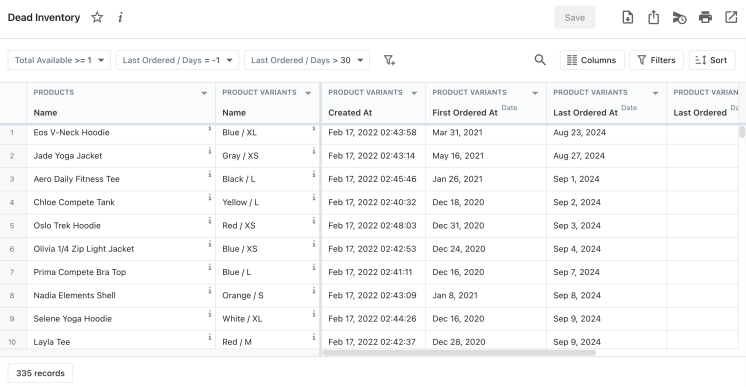
Dead inventory
Dead stock is your frozen assets. The report shows those products that were not sold during the month. The table shows the indicators:
- The date of the last sale of the product (if it was sold at least once).
- The date of the last order of the product from the supplier.
- Amount of balance.
- Unit cost.
- Total cost.
- How many days have passed since the last order.
ABC analysis
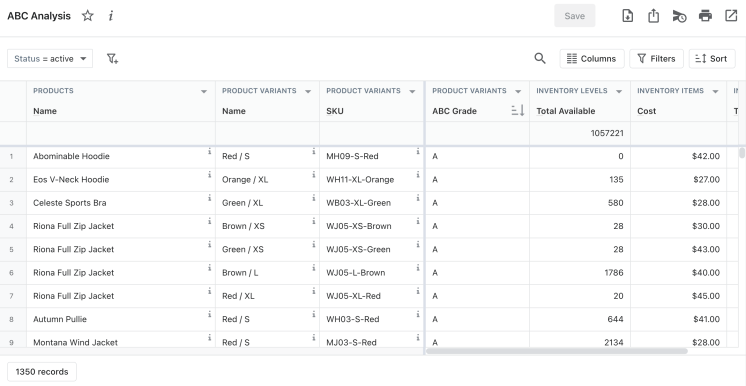
ABC analysis will tell you which products bring you the most income. This report divides products into three categories:
- Bring 80% revenue.
- Bring 15% revenue.
- Bring 5% revenue.
Depending on this distribution, you can adjust the purchase of goods, marketing strategies, and in general carry out Shopify inventory management more effectively.
Cost-effective & Essential Inventory Management on Shopify to Optimize Your Business
Using the inventory of reports and implementing effective strategies, you will be able to achieve better results and ensure the stable growth of your store.
- Reduction of storage costs: Using the Dead inventory report, you can avoid surpluses of unnecessary goods and thereby reduce the costs of maintaining stocks.
- Avoiding shortage of goods: Inventory planner report will help to effectively organize the entire process of stock replenishment and predict the next purchase date.
- Acceleration of inventory turnover: The faster the goods can be sold, the faster you get a profit from the money invested in the inventory. Knowing the sales velocity and analyzing the goods with the help of ABC, you can focus on the goods that are in the greatest demand and adjust purchases accordingly.
- Automation of business processes: By integrating Shopify with Google Sheets through tools like Mipler, you can automate your reporting. This allows you to save time and receive relevant data in real-time for making operational decisions.
Important
Effective inventory management helps your Shopify store stay successful. Using Inventory Reports, store owners can optimize inventory levels, set strategic reorder points, and understand the financial value of their inventory.
Other Shopify Reports will help you analyze sales, customer behavior, orders, and shipping conditions.
FAQ
How to track inventory on Shopify?
The most convenient way to track inventory is through Shopify inventory reports. With their help, you can control the level of stocks, plan their renewal, and track movement between different warehouses.
What is inventory in Shopify?
Inventory is store products ready for sale to customers. It is also the most important asset of the store, without which the operation of the store is impossible.
What is the best Shopify inventory management app?
Mipler delivers exceptional inventory reporting tools that shows your sales pattern insights and overall product performance.
Does Shopify keep track of inventory?
Yes, with the help of special reports, owners of Shopify stores can manage inventory.
What advanced features does Shopify Plus inventory management offer for multi-location warehouses?
Shopify inventory management apps controls inventory better by using demand forecasting together with bulk transfer options and custom fulfillment rule settings.
How does Shopify POS inventory management help track stock levels in real-time?
Stock levels at Shopify POS automatically updates inventory numbers to prevent stockout and inaccurate records in database.
