E-commerce heavily relies on proper inventory management. Failing to account for resupply shipping delays, increased demand, or low stock can halt trading and hinder your revenue. On top of that, many Shopify merchants have a few warehouses from which items are delivered. In these situations, inventory management becomes vital. Previously, we discussed sales velocity and how it affects resupply policy. Today, it's time to dissect a cornerstone of inventory planning – the reorder point.
What Is a Reorder Point (ROP)?
The term is almost self-explanatory: reorder point shows a stock level at which you should reorder goods. For instance, let's say your Shopify store sells laptops. The reorder point for a certain Lenovo laptop is 5. It means that when you have only 5 of these laptops in stock – you need to order more from the dealer to avoid stockout.
Of course, each item has its own reorder point. Calculating some generalized number, even for a few products combined, is impossible. Each item has its own demand, stock, and often restock process, so calculations must be done separately for every product and variant.
Inventory planning
The term itself is a part of a larger process called inventory planning. It is not just a synonym for restocking, though. Inventory planning is a problem-solving exercise to align sales with resupplies to minimize downtime. The reorder point is one of many metrics and techniques used in inventory planning.
Just in time
One other technique that is often used in pair with a reorder point is Just-in-Time inventory, or JIT for short. This strategy aims to order products within a tight timeframe to minimize storage costs. Speaking simply – the second batch arrives just as the first sells out.
To execute the JIT strategy, you need to know reorder points of all items and let them sell just a little more than the metric suggests. If done correctly, you can squeeze some efficiency out of your processes. However, poor planning can lead to an unexpected stockout.
Explore related reports
Why Is Reorder Point Important?
Knowing the reorder points of your items allows you not to guess but to know for certain when you need a resupply. Trying to restock at empty shelves is akin to gambling – you never know if items will be available fast enough not to lose sales due to stockout. But you may have dead-weight items in the warehouse if you buy goods long before the stock is depleted. Demand will drop, but items will stay.
Moreover, you cannot constantly track all positions from inventory even if you know your resupply time by seconds and customers by names. Metric with a formula and a solid number as an outcome brings simplicity and quickness to your inventory planning. No guessing, no gambling. Just a healthy replenishment process with reliable outcomes.
How Are Reorder Points Used?
Reorder point practical usage for any Shopify store is quite simple. Once you calculate it for your inventory, track it and replenish stock whenever the number of available products reaches the reorder point.
However, there is also an analytical usage for this metric. If a reorder point changes suddenly, it may indicate a problem in the sales pipeline. For example, sudden growth may indicate that sales are dropping or that the dealer now takes longer to deliver a new batch of goods.
Usage tip: recalculate reorder points for items at least every month. Demand might shift, and resupply might be needed sooner than you expect.
How to Calculate a Reorder Point
There are two formulas for calculating a reorder point. Each is suitable only for individual items, not collections, bundles, etc. The first assumes that you have no safety stock that can be used in case of sudden delays in the supply chain. The second one counts in potential safety stock. Whatever formula you will use for your Shopify store, remember to update results frequently.
Reorder Point Formula
A basic reorder point equation needs only two variables: average daily sales and lead time. To get the reorder point, you simply need to multiply one by another. Here is how the formula looks:
Reorder point = Average Daily Sales × Lead Time
Average daily sales are the same as sales velocity, which we discussed in the previous article. To get it, you need to divide the number of sales in a certain time frame by said time frame. For example, if you sold 100 red caps in 4 days, divide 100 by 4 and get 25 average daily sales.
Lead time is a time frame in which your supplier can deliver your next bundle of items. For instance, if it takes 5 days to deliver an ordered batch of red caps, the lead time will be 5 days.
If we use both values from our examples and insert them into the formula (25 x 5), we will get a reorder point of 125. It means you should order more red caps when you have only 125 in stock.
Reorder Point and Safety Stock
However, you might have some extra stock that you use only in emergencies. This type of stock is called safety stock. To account for it, you simply need to add it to the result like this:
Reorder point = (Average Daily Sales × Lead Time) + Safety Stock
If you want to calculate safety stock for a certain amount of days with current demand, you can use this formula:
Safety Stock = Average Daily Sales × Safety Days
Safety days are the number of days that safety stock must cover.
Tips on managing and prioritizing
As said earlier, reorder points must be recalculated often to keep in touch with demand. Metric itself is designed to help you with inventory planning. However, when you have not tens but hundreds of items to sell – it may be challenging to account for all of them. Luckily, we have advice that may help you with calculations.
Use reports
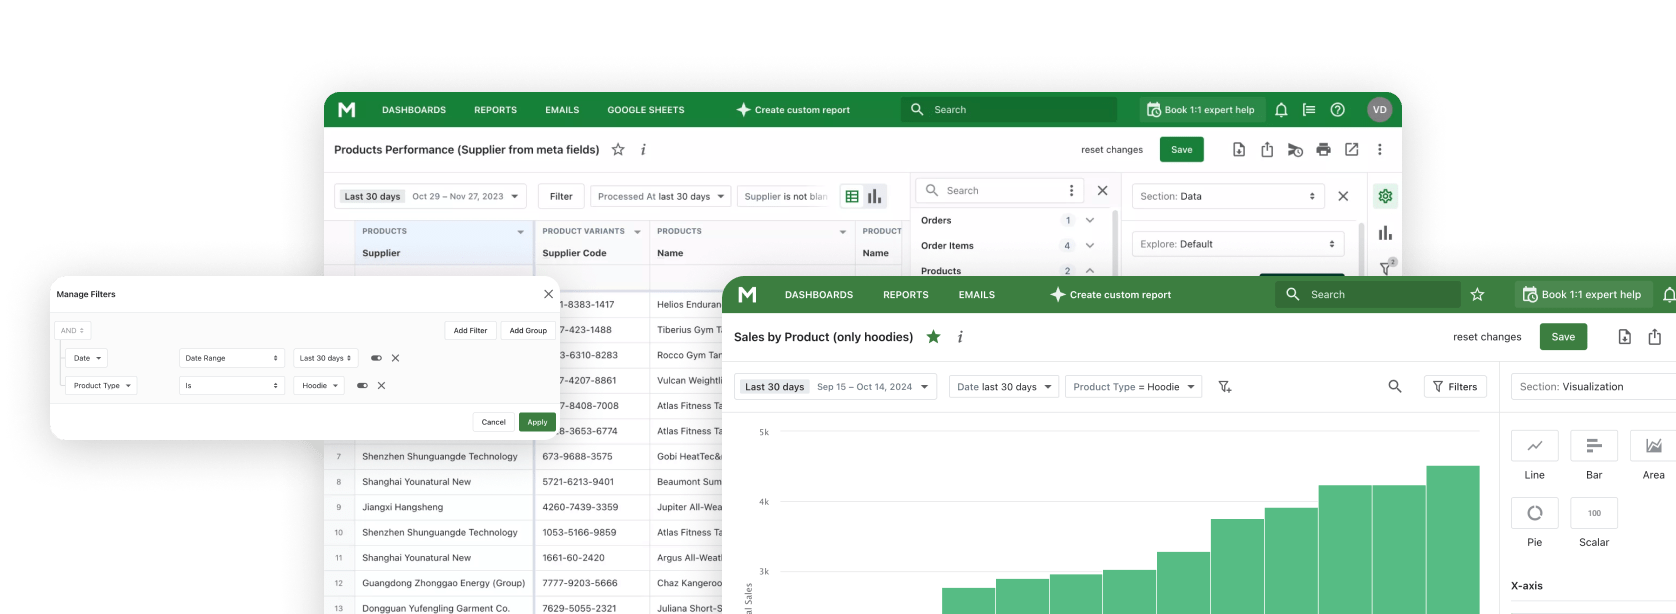
Your Shopify store can be connected to different apps that provide additional features. These apps can help you with metrics, simply calculating them for you. You can use pre-made Shopify Reports to view statistics about your stock or even create a custom report showing you reorder points. Once you set it up, you don't have to recalculate reorder points by hand, saving time and effort.
Apply the ABC priority technique
Another technique that may help you with recalculating is determining the priority level for your items. ABC method is popular in this regard. We already covered it in a previous article, but these techniques are multifunctional and can help organize many different processes.
The ABC method offers you to rank your items according to their importance for your shop. A-rank products are the ones that make you most of the revenue. B-rank items are important and valuable but not the cornerstones of your commerce. C-rank stock will have the least impact on your commerce if anything happens to it, good or bad.
After you figure out your rankings, update reorder points for A-ranks every week, B-ranks every month, and C-ranks every season. This way, you can lift some work from your shoulders. You can also delegate analysis of different ranks to managers with different experience if you have staff. For example, let juniors study C-rank products and try to increase their velocity.
Mipler's inventory reports for inventory planning
Our inventory app for Shopify stores is one of the apps that benefit from reorder points and may help you with inventory planning. Let's see how, so you may decide if you need it.
Pre-build reports
Shopify Inventory Reports from Mipler offers you a plethora of ready-to-use reports. Among them, you can find a few that help specifically with inventory management and forecasting:
- ABC Analysis. This report shows your inventory ranked via the ABC method we described earlier. It shows the item's rank, stock, sales velocity, how much time stock will cover, and stockout quantity.
- Inventory on Hand. Here, you can see all the information about your current stock. The report shows if items can be replenished, lead time, safety stock, overstock time, etc. This is your go-to report to keep a pulse on your inventory.
- Dead stock. In this report, you will see all the slow-going products, how many left, and when they were first and last time sold. If you see an item last sold half a year ago while others sell daily – you might reconsider your advertisement strategy for them.
- Locations. This report simply shows all of your warehouses and how much stock they have in quantity and monetary value. If a certain spot is underused, you might need to expand or close operations there.
- Overstock. Here, you can see items with low sales velocity and high stock. The report will also tell you the overstock quantity and how many days the current amount will last. If an item is in this report, it is clear that you don't need another batch of it.
- Replenishment. With this report, you can strategically resupply your stock. It shows product demand, sales trends, and stock levels so that you may restock at an ideal rate.
- Stockouts. This report shows you items that are closest to the stockout. Knowing this, you can avoid shortages and resupply in time.
Custom reports
However, the functions of the app don't stop at pre-made reports. All of them, including ones about inventory planning, can be edited to your liking. Let's say you don't need to know when you first sold any of the current dead-stock items. Well, you can just delete an unnecessary column with this info. Or you can add a sales velocity column to see how low the current demand is.
Moreover, you can create new reports. Some Shopify stores may require very specific inventory analysis and planning due to the nature of commerce or sold goods. With Mipler's Advanced Reports, you don't have to go by only standard options. Make reports from scratch to fit your business's every need.
Dashboard
Often, even having all the important info on hand isn't helping because said info is buried in dozens of menus and tabs. The app solves this problem as well. You will get reports and a handy Shopify Dashboard to display all important data.
The dashboard can be customized to your liking. You may move, add, edit, and delete any widgets to surround yourself only with info that matters. Make your dashboard minimalistic or add any potentially important piece of data. Add custom reports on the dashboard. Use filters and sorting to analyze data from different time frames.
You can also create a few different dashboards to show specific information. For instance, one board may show troubled parts of the business: dead stock, overstock, stockouts, and Shopify Custom Reports on the same topic. A different board may monitor inventory generally, showing locations, stock on hand, etc. This way, your attention will be focused on one process at a time, making management easier.
Summary
Inventory planning can make or break your Shopify store. With a good grasp on restock timing, you can easily avoid stockouts and dead-weight products. Reorder point can help you with that. Calculate it frequently for each item, and you will keep up with the demand, boosting the efficiency of your inventory planning higher than ever.
However, you must use apps to truly squeeze maximum efficiency out of metrics such as reorder points. For example, the reporting module from Mipler. It can quickly do all the math and display results coherently. You can set up dashboards and use filters and sorting to track inventory, avoid shortages and overstock, and dispose of dead-weight items.


