Accurate forecasting of necessary inventory and demand planning is a constant operational activity for any store that operates with its own warehouses. Precise forecasting helps avoid two critical situations:
- Stockouts of essential items;
- Unjustifiably high overstock of goods in warehouses
While inventory forecasting is just a projection, with the right approach, it allows maintaining optimal stock levels consistently. Unlike other reports (such as Shopify Inventory Value Report), inventory forecasting (also known as demand planning) poses questions for all three time periods:
- Past: How many products were sold and how quickly?
- Current: What is the actual stock status now?
- Future: How many products do we need, when, and how quickly?
It is worth noting separately that there are several different strategies/approaches to inventory planning. No strategy is exclusive, and they can be combined, adjusted throughout the year, or applied differently for various product groups.
-
Continuous Availability Strategy:
Maintaining a large quantity of inventory to cover both current and potential seasonal fluctuations.
-
Minimum Inventory Level Strategy:
Keeping the minimum possible quantity of goods in stock. Requires reordering even with a slight increase in demand.
-
Demand-Oriented Planning:
Planning the optimal inventory for each item based on current demand.
These are just a few of the strategies commonly used in e-commerce.
Questions That Inventory Forecasting Can Answer
Since inventory forecasting is a complex topic that involves many processes, typically, a separate report is used for each question and answer due to its multifaceted nature. Let's explore some of the most relevant problem-solution pairs:
- Sales Velocity: How quickly inventory is utilized (sales velocity).
- Minimizing Out-of-Stock Occurrences: How to minimize the chances of product unavailability in the warehouse.
- Replenishment Timing: When to replenish stocks.
- Identifying Dead Inventory: Which inventory is non-selling (i.e., has been inactive for a long time considering the current stock).
- Managing Overstock: Which inventory is excessive.
- Turnover Ratio: What is the turnover ratio for stock.
- Pricing and Discount Policy Review: Which products require a review of pricing or discount policies.
While this list is incomplete, it provides a general overview of the issues that can be addressed through inventory planning.
Explore related reports
Inventory Forecasting
In general, to forecast how much inventory we need for the next week or month, we must understand how much product we plan to sell during that period – this is the sales velocity (also known as the average daily sales volume).
Once we have calculated the sales velocity, we can easily determine the quantity of products we need for the next 14 days. Additionally, since products are ordered from suppliers, we also need to know when to place an order with the supplier – the reorder date. Alternatively, we can determine the reorder point (ROP), which is the minimum quantity in stock at which we should place an order.
Furthermore, for more accurate forecasting, external factors such as delivery lead time should be considered. Lead time is the number of days needed to transport goods from the supplier's warehouse to our own.
As a result, for a simplified (linear) forecast, we just need three values:
- Sales Velocity
- Actual Quantity
- Lead Time
Using these values, numerous derivative metrics can be calculated and utilized in the forecasting process.
Key Terms, Metrics and Calculations
The provided graph illustrates a linear model for maintaining optimal inventory levels based on three key metrics (sales velocity, lead time, and stock quantity).
-
Sales Velocity
Sales velocity represents the rate of product sales within a fixed time period, typically calculated for one day.
Simplified formula over the last 30 days:
Sales Velocity = Sold Quantity ÷ 30
This metric indicates the average number of units sold per day. With this information, one can calculate the expected sales for the next 14/30/90 days.
-
Lead Time
Lead time is the duration required to receive products in your warehouse from the moment the order is placed, encompassing all necessary steps such as placing an order with the supplier, signing, delivery, etc.
Lead time is generally a fixed value for each supplier.
-
Lead Time Quantity
Lead time quantity determines how many products will be sold during the lead time (forecasted sales).
Lead Time QTY = Lead Time × Sales Velocity
-
Service Level
The expected probability of avoiding stock-outs during the next replenishment cycle, usually ranging from 70-90%.
Excessively high service levels lead to unnecessary increases in inventory, while too low levels increase the risk of running out of stock.
-
Safety Stock
Extra inventory quantity (buffer or reserve) to prevent stock-outs in case of unforeseen issues.
Safety Stock = Sales Velocity × Lead Time × Service Level
Safety stock can be manually set for individual items, affecting the calculation of quantity and reorder time.
-
Reorder Point (ROP)
The stock quantity that triggers replenishment.
Reorder Point = Safety Stock + Lead Time QTY
-
Stock QTY
Actual stock quantity (overall or per warehouse inventory planning)
-
Stock Covered Time
How many days the current stock will cover sales.
Stock Covered Time = Stock QTY ÷ Sales Velocity
-
Stockout QTY
An indicator of future inventory shortage. If positive, it signifies a deficit, indicating that existing stock will not be sufficient in a defined period
Stockout QTY = Lead Time QTY - Stock QTY
-
Replenishment Quantity
The minimally optimal quantity of products to order to avoid stockouts.
Replenishment QTY = Reorder Point QTY
-
Replenishment Time or Time To Reorder
When (how many days) products should be reordered.
Replenishment Time = (Stock QTY - Reorder Point QTY) ÷ Sales Velocity
Key takeaways
- Forecasting requires a history. On seasonal markets, improving forecasting accuracy necessitates at least one year of sales history. In other stable (linear) markets, a sales history of the past 30-90 days is typically sufficient.
- Modern reporting and planning platforms empower inventory management akin to an expert.
- While numerous non-programmable factors may impact planning accuracy, having a planning system is foundational and imperative. Remaining informed about the current market situation and adjusting forecasts and plans accordingly is essential.
Examples of inventory planning reports for Shopify
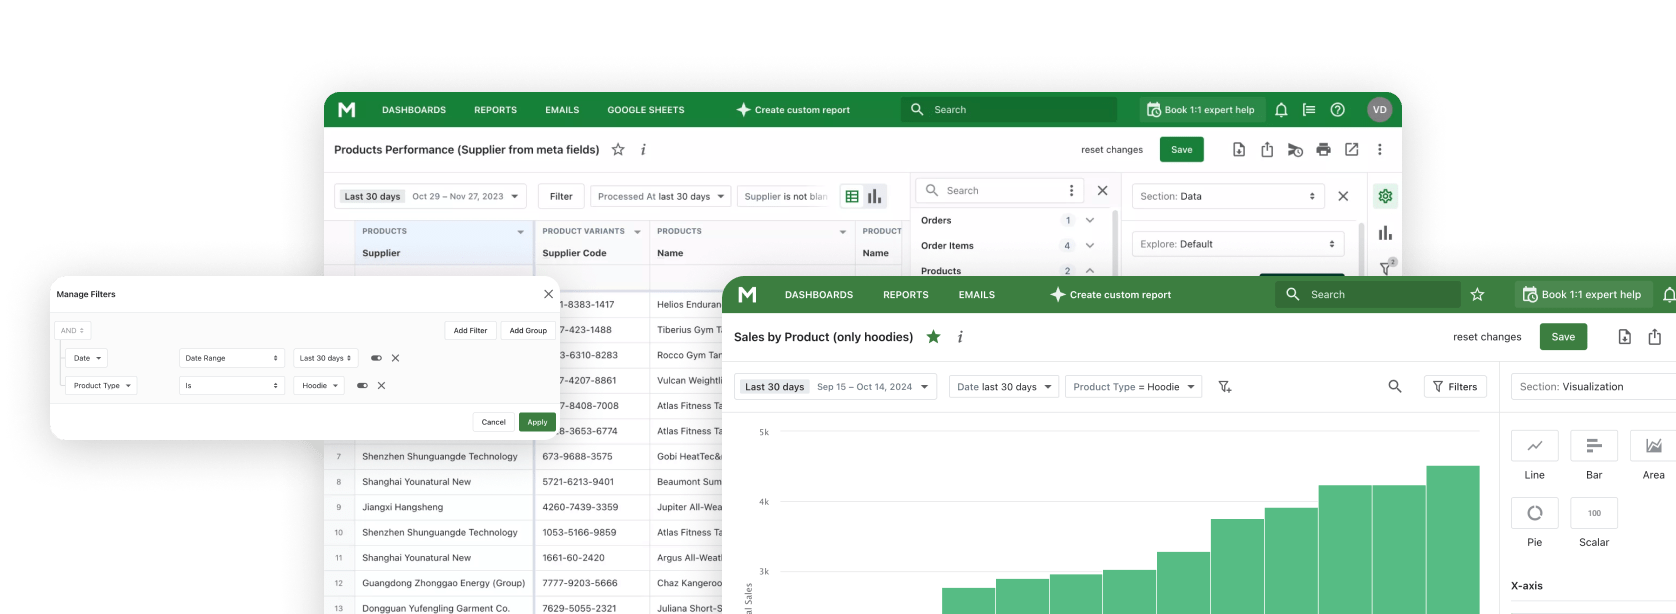
Below we collected different variations of inventory forecast and demand Shopify Reports that can be with our app..
Additionally, you can adjust built-in Shopify Inventory Reports or create new reports.
| ProductsName | Product VariantsName | Inventory LevelsTotal Available | Inventory PlannerSales Velocity | Inventory PlannerStock Covered / days | Inventory PlannerForecast QTY | Inventory PlannerReplenishment QTY | Inventory PlannerReplenishment time / days | Inventory PlannerStockout QTY | Inventory PlannerSafety QTY | Inventory PlannerReorder Point QTY |
|---|---|---|---|---|---|---|---|---|---|---|
| Cassius Sparring Tank | Blue / XS | 15 | 0.53 | 28 | 12 | 15 | 0 | 0 | 3 | 15 |
| Cassius Sparring Tank | Blue / XL | 3 | 0.30 | 10 | 7 | 9 | 0 | 4 | 2 | 9 |
| Cassius Sparring Tank | Blue / L | 4 | 0.23 | 17 | 5 | 7 | 0 | 1 | 2 | 7 |
Inventory Planning in Google Sheets

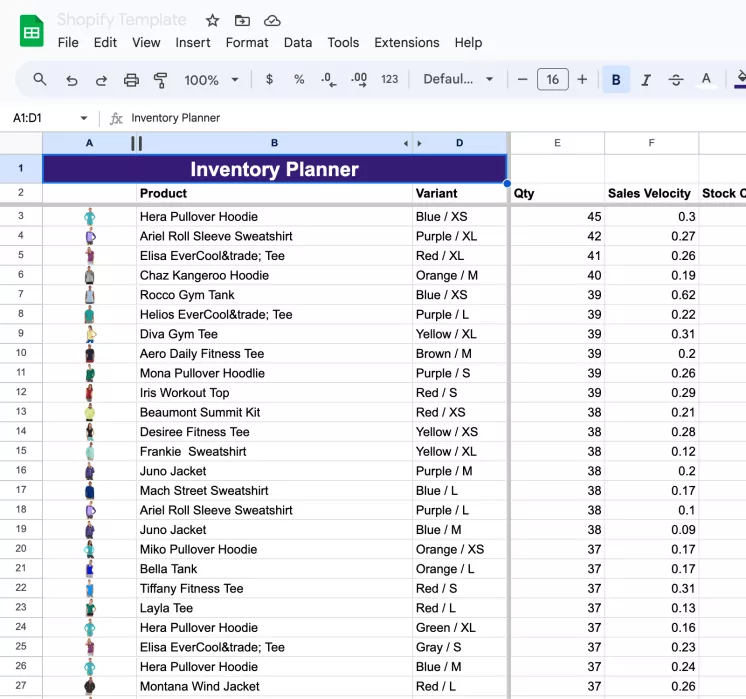
You can even plan inventory in Google Sheets, provided you have a mechanism for uploading the current product list along with their quantities on hand. All other parameters can be easily calculated using the formulas provided above. You can find a free template for Google Sheets.


