Types of Shopify Sales Reports
What Shopify reports automated data analysis is available
In this article, we will look at different types of reports and give examples of how to use them.
Reports on orders, items returned
Get a summary document on what goods were ordered and how many of them were returned assists with understanding which items can be referred to as blockbusters, and which one get returned regularly. The document shows complete number of items that were requested throughout the chosen time span and the number of them that were returned.
Taxes finance report
The Taxes report shows the sales taxes that were applied to your sales in the selected timeframe. Each row of the report shows a tax type (such as a state tax or a county tax), its rate, and the total amount of tax that was charged in the selected timeframe.
The report determines the country and region based on the destination of sales, so it might show destination information even for origin-based sales tax jurisdictions. To determine the destination, the shipping address is used.
If the shipping address cannot be determined, then the billing address is used. If the billing address cannot be determined, then the POS address is used.
Canceled payments
If a payment has been authorized but is canceled before the payment can be captured, then an amount greater than zero and a corresponding number below zero will be shown in the fields that are available in sales reports.
On the grounds that a request was set a positive sum is shown. A discount is displayed to adjust the report. In any case, nothing will show up in the installments finance reports since a merchant didn't get an installment.
Shopify Sales Reports
Sales and revenue can be boosted with analytics
Every successful owner of any successful store should always be aware of all the events that happen to his store.
This allows you to notice problems early on, to make appropriate adjustments that will not allow you to lose profits, and in the future will even allow you to increase them. That's why it is so important to use different reports and why it is important to understand them.
Reports for Daily Sales
This simple report shows the daily totals.
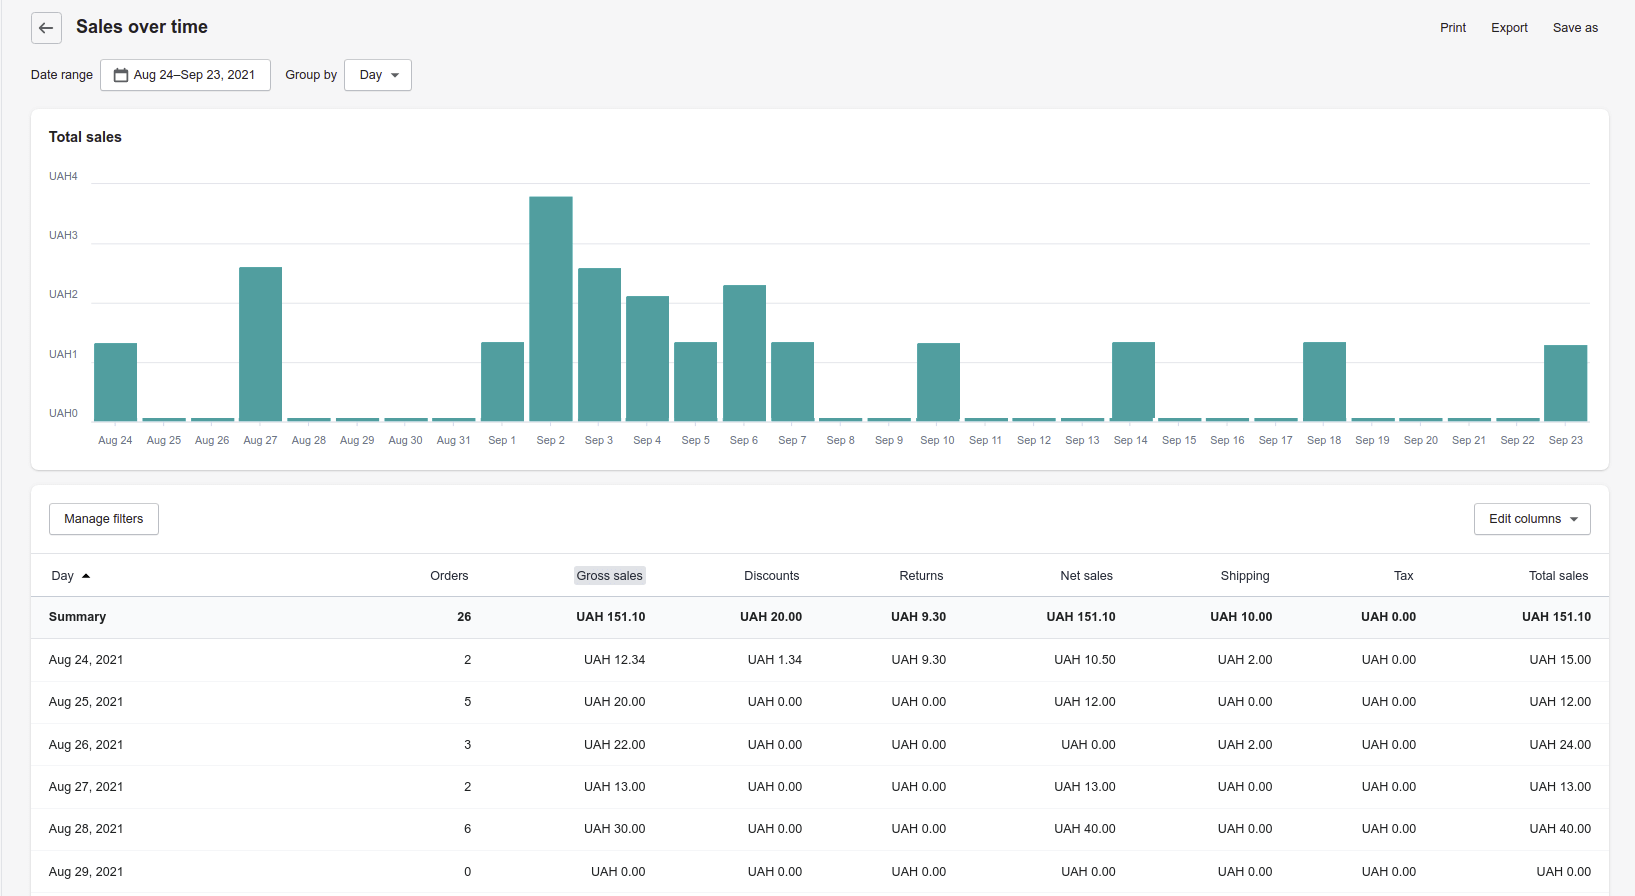
It is usually shown with other days. This way you can easily understand the average sales of the previous days and compare it to the last day. Thus, if something has gone wrong, you can always track it down. There are all kinds of cases.
For example, the best selling product is out of stock, or for some technical reasons the user cannot go to the checkout page, or, for example, the advertising funds have run out and the contextual advertising is no longer displayed, which reduces the number of visitors to the site.
Reports for Monthly Sales
Monthly sales reports in Shopify are similar to the previous one, but the main difference is that they are grouped by months instead of days.
Typically used to analyze sales for the year.
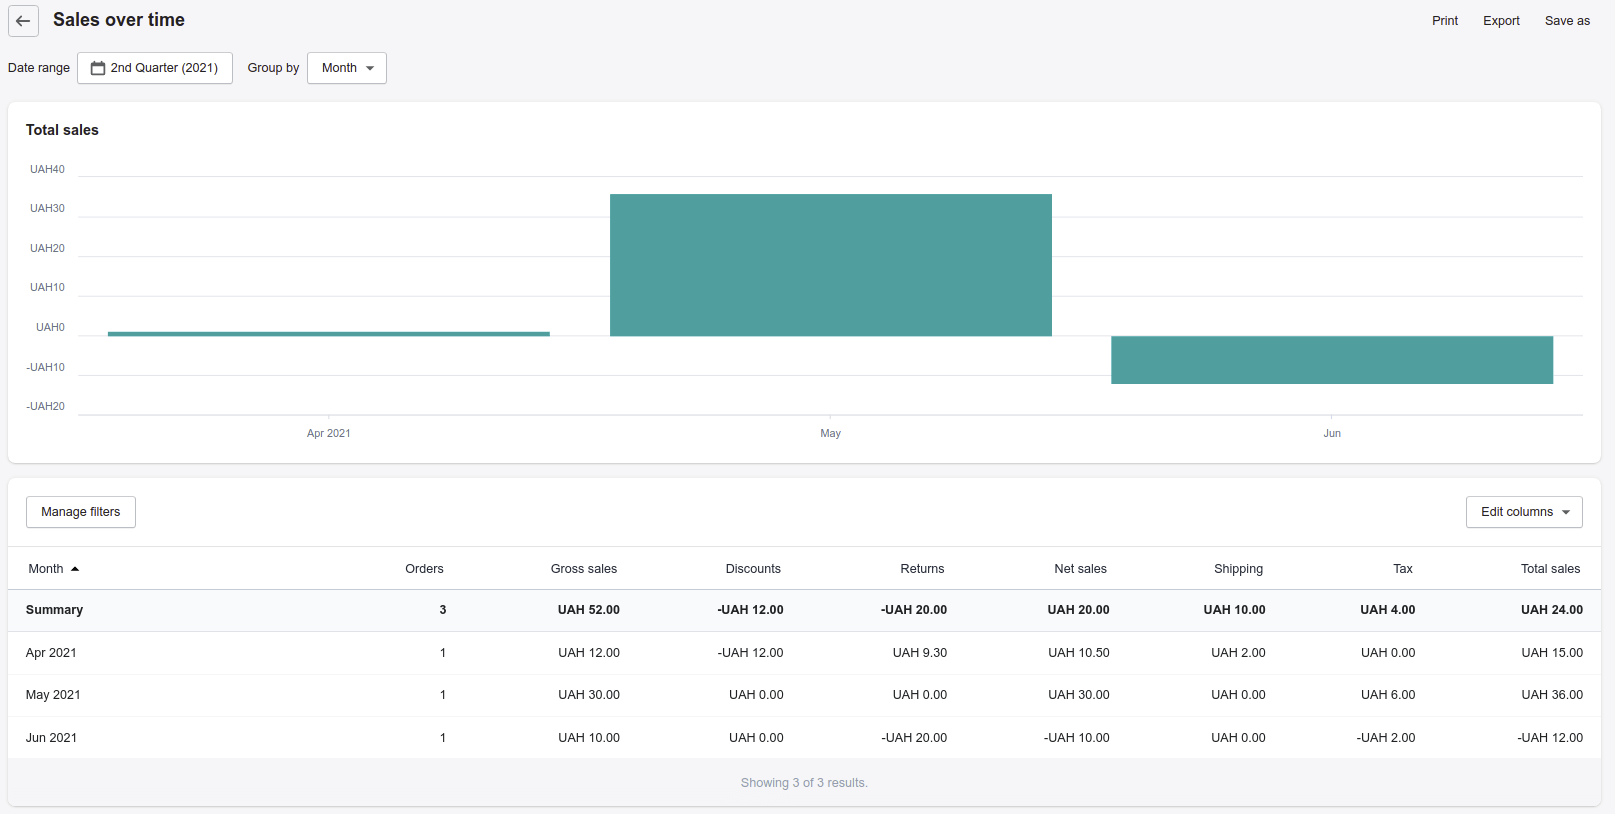
With data over several years the seasonality of sales can be tracked and decisions based on it can be executed.
For example, it may not make sense to massively replenish the stock in the summer, because experience shows that sales during the vacation season fall a bit. But you should be well prepared for Black Friday, when customers are in the mood to buy a lot. It would be bad to miss such a chance and not get the desired profit from the fact that the goods in your warehouse ran out.
Reports for Sales by States
This type of sales reports in Shopify is so-called GEO reports and it helps you understand the composition of your customers. Where the most orders come from. For example, in Shopify, you can get sales reports by states. Understanding this can lead to useful insights.
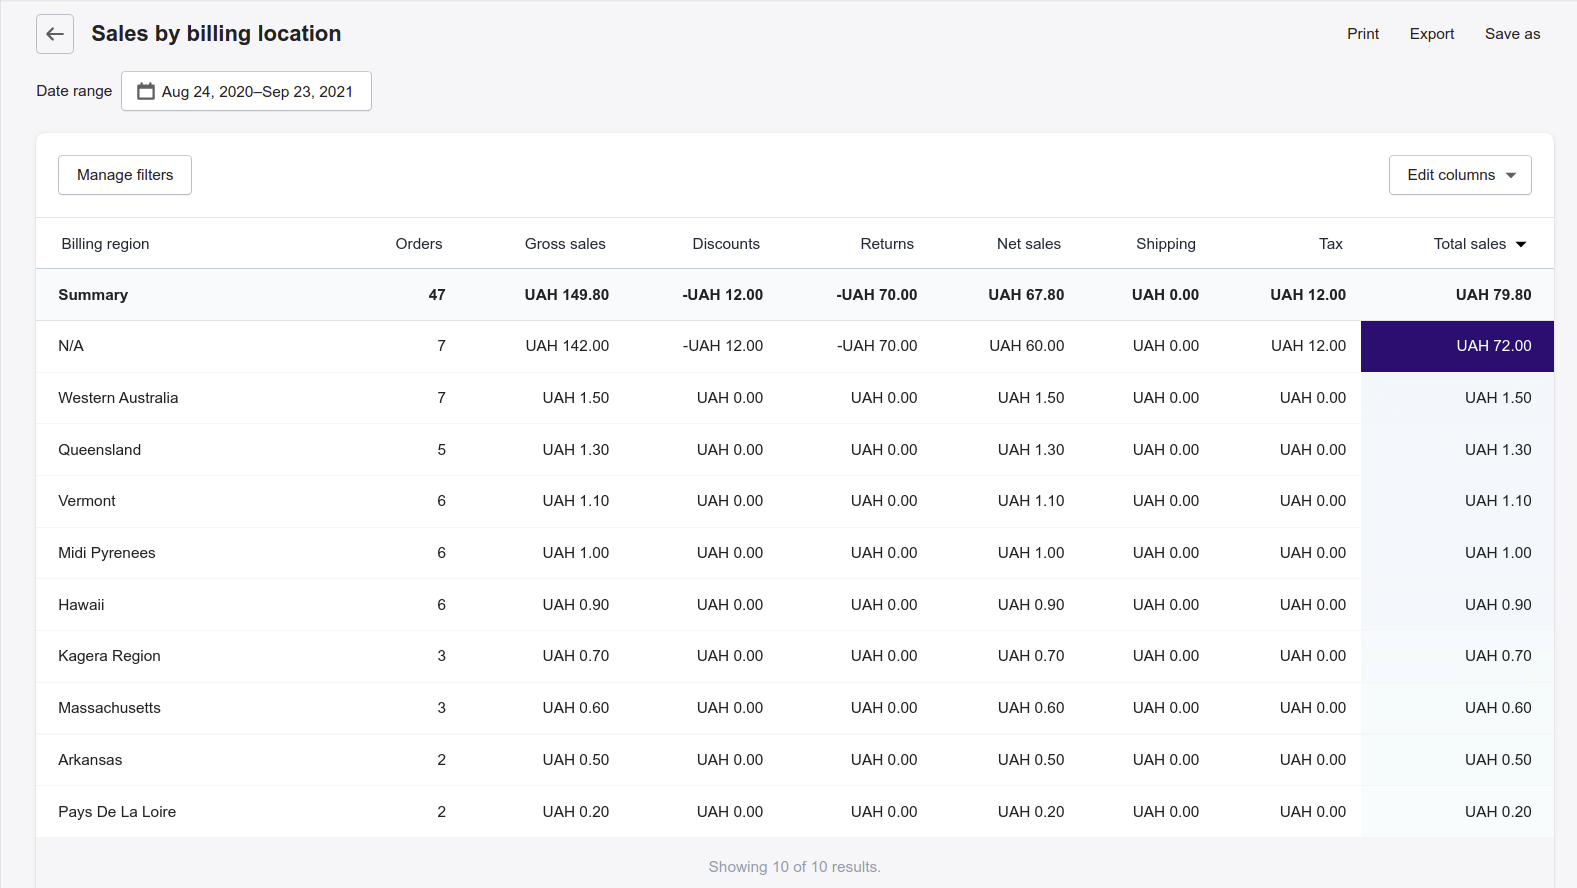
For example, such a report will show you which state or province to focus on. So, if you run contextual advertising on all the states, spending the same amount on each state, but one state brings you $1,000 a day and another only $10 a week. In this case, it might make sense to run ads only for the most profitable state or reconfigure your ads to be effective for the other states as well.
Reports for Product Sales
A report showing sales for each product. It helps to identify your bestsellers and bad sellers.
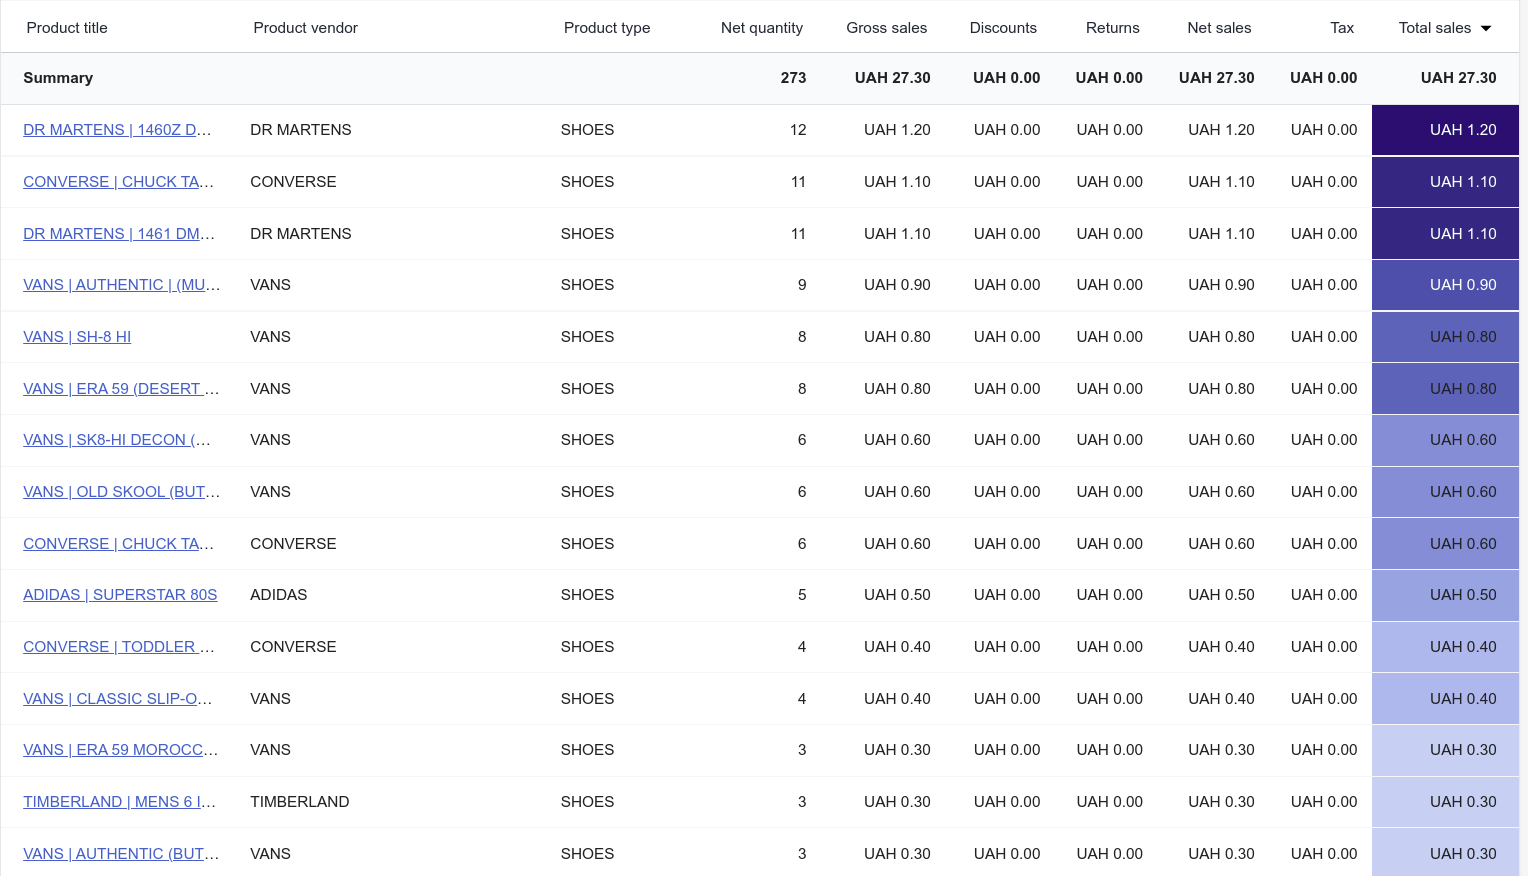
No one can deny that hoped-for and poorly selling products are a headache for all product owners. It might make sense to have a clearance sale on those products to make room and money for products that are selling well.
Reports based on Orders
Usually, such reports are used when processing returns and forming shipments. For example, you may filter out orders that have been paid but not shipped. Thus, we can see the entire list of orders that can be shipped on one screen. Most often used for the period of the last few days.
Unfulfilled orders in Shopify:
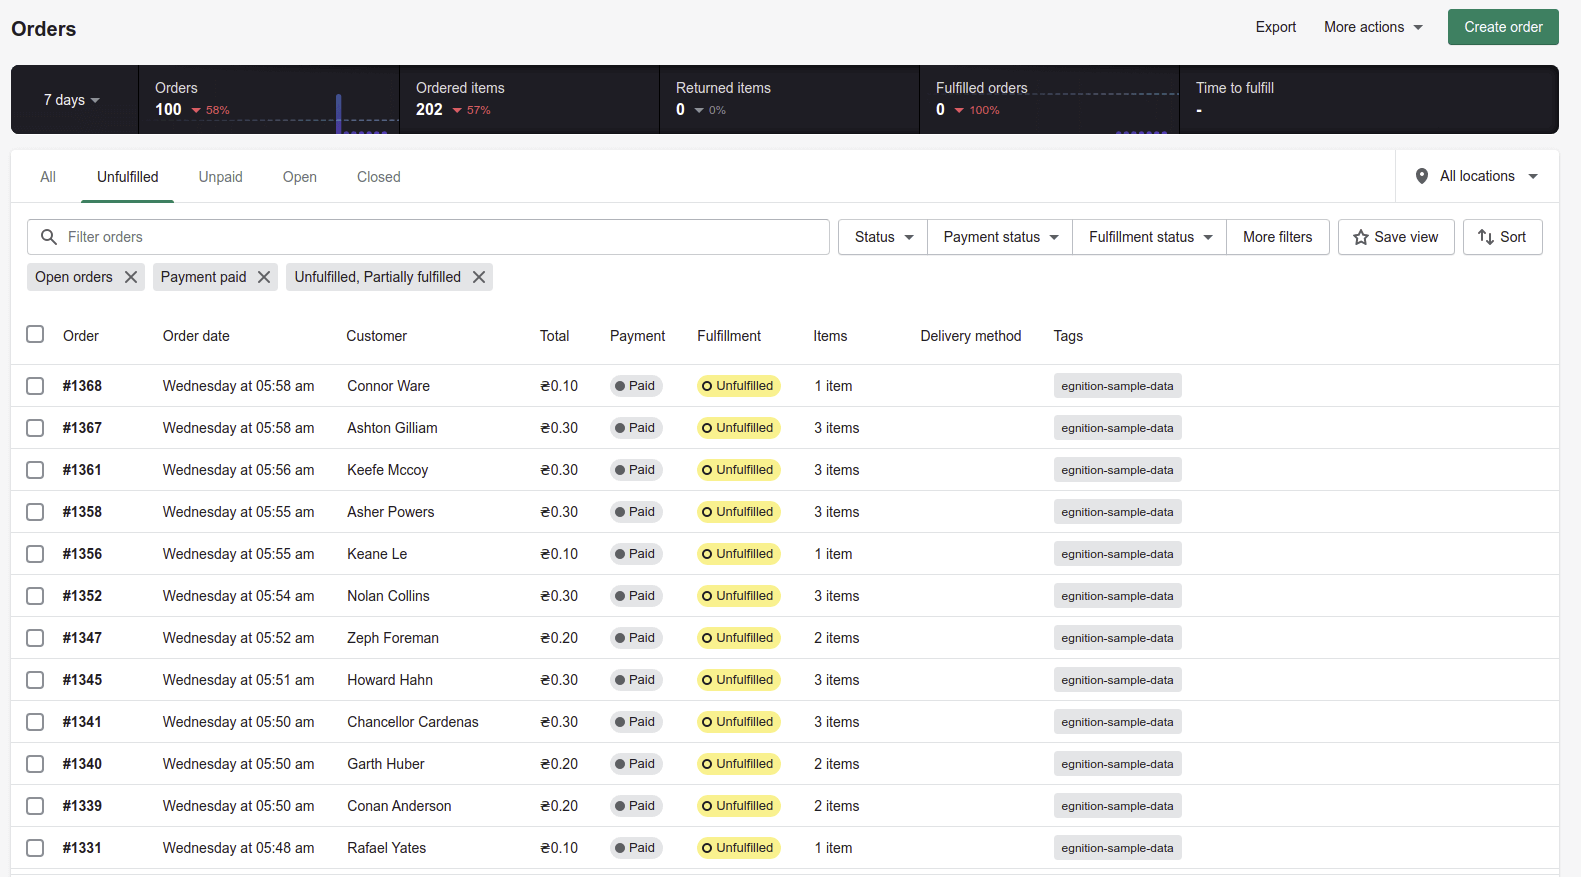
This report is good, but you need to open each order to see the products included.
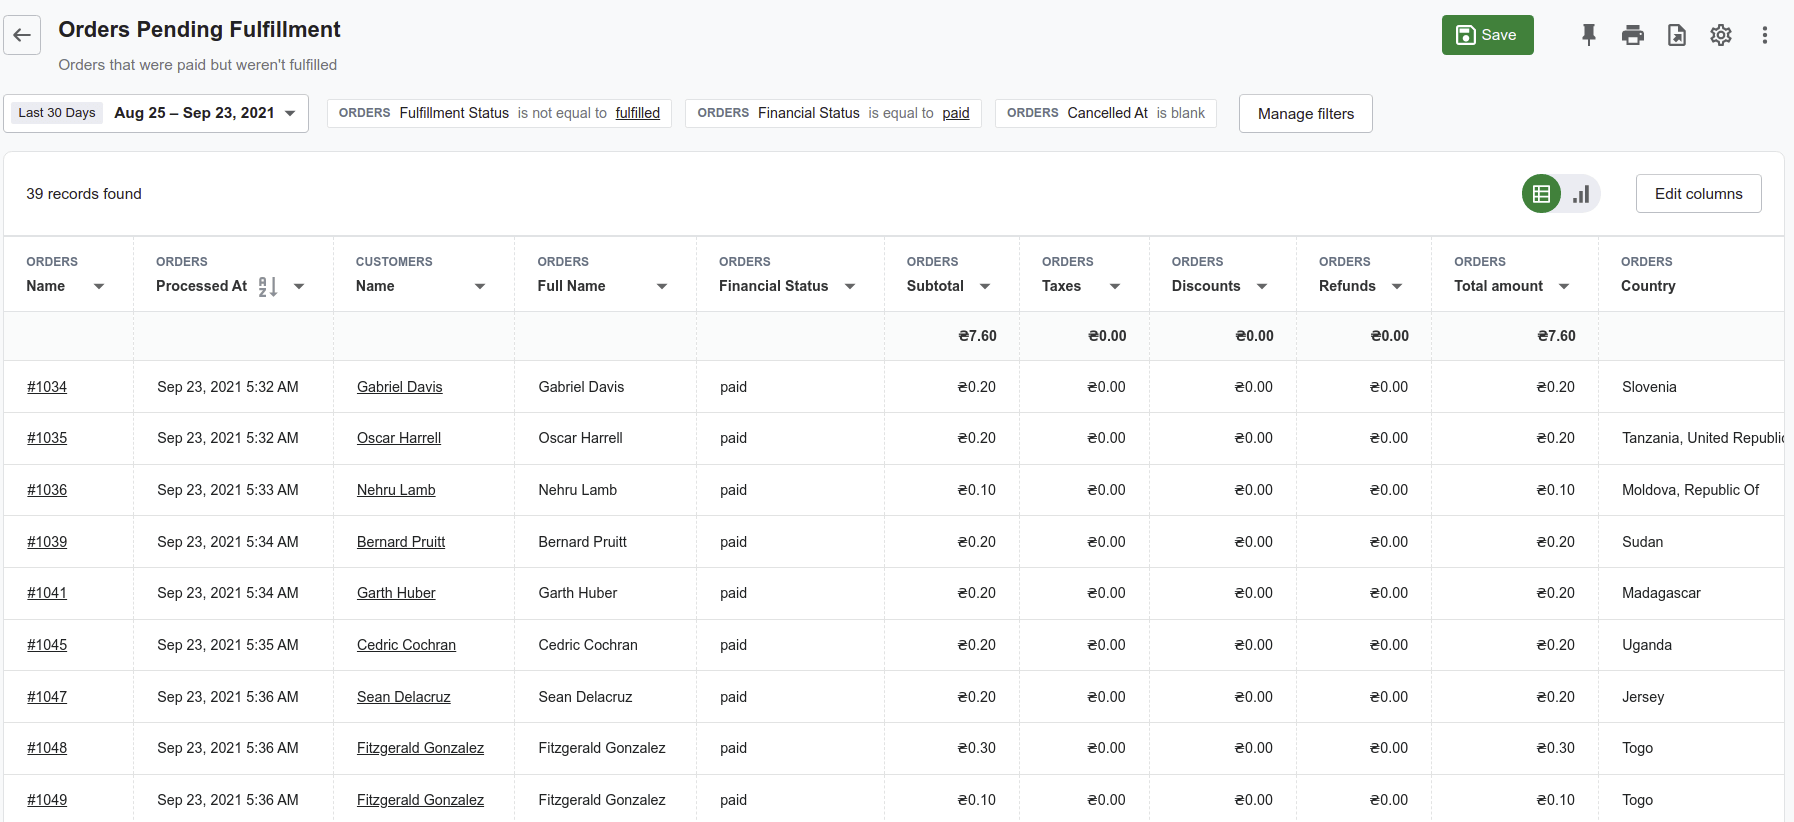
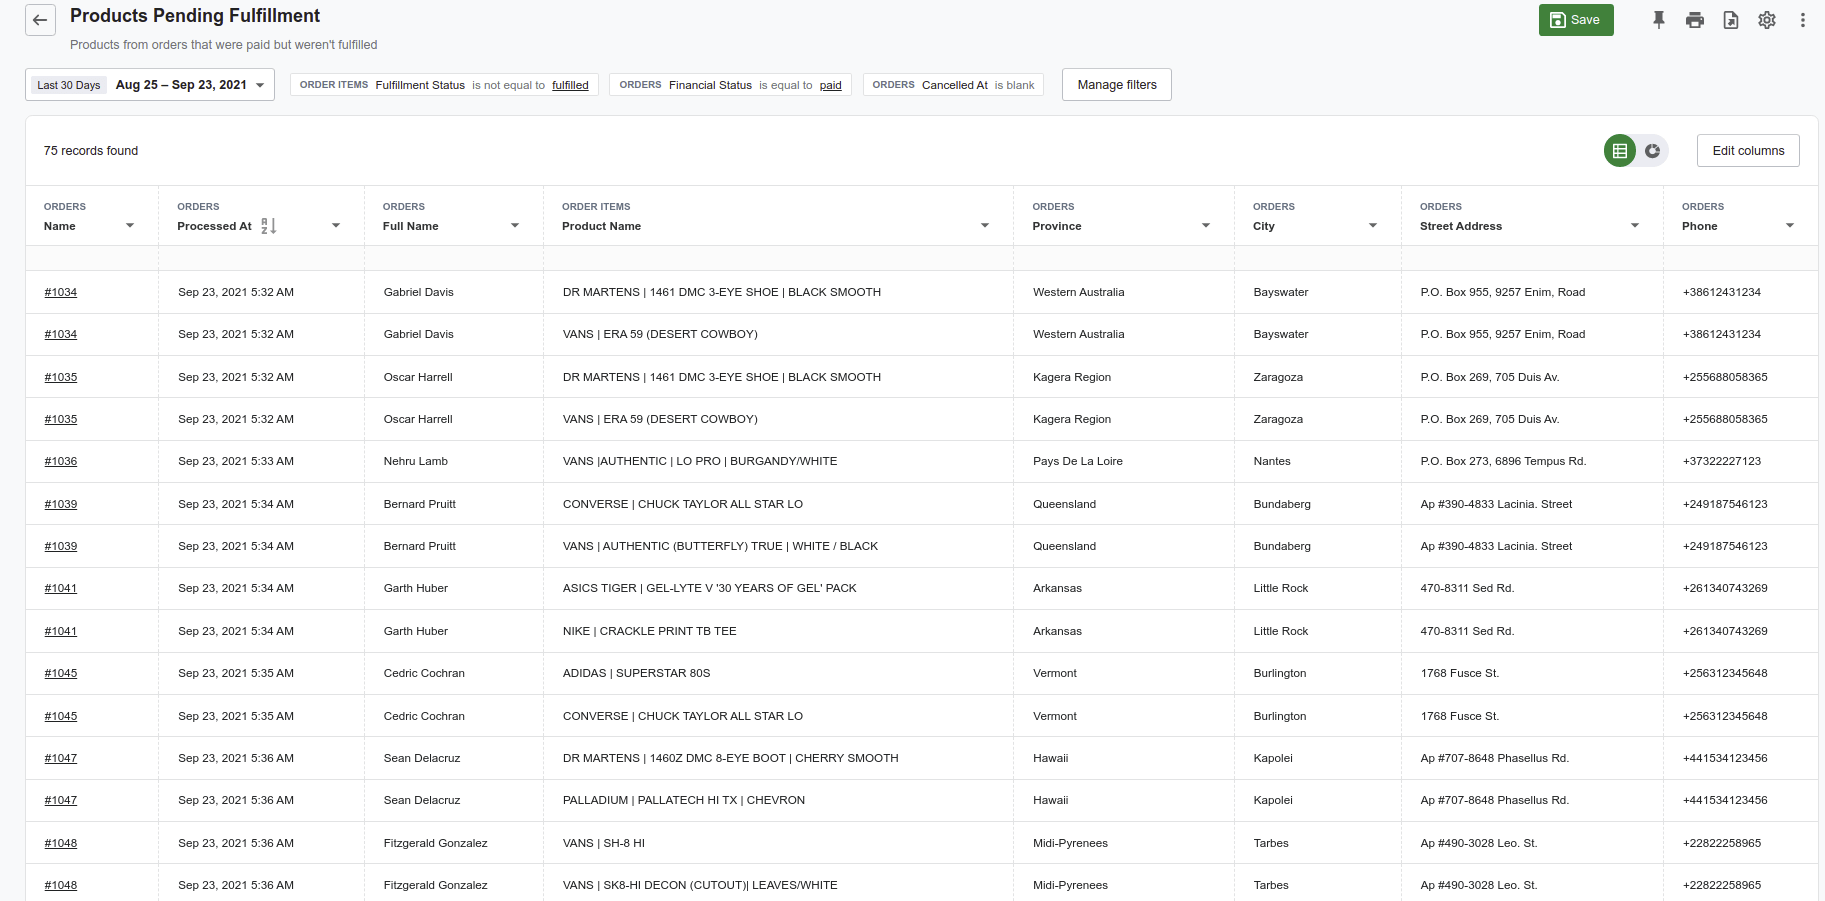
So in our advanced reports, in addition to the same unshipped orders report:
We offer a report on products from unshipped orders. This way you can see how much of each product is a pending shipment.
Inventory Reports to help boost sales
Stock status is a very important factor for successful sales. Experienced retailers always keep track of how much and what products are left in stock.
First of all, you need to pay attention to Low Stock products - these are products with a quantity of 1 to 10 in stock. Depending on the marketability of the product.
For example, if you are a big supplier of micro parts, like transistors or resistors, the Low Stock value for the sold items can be in the thousands and even tens of thousands.
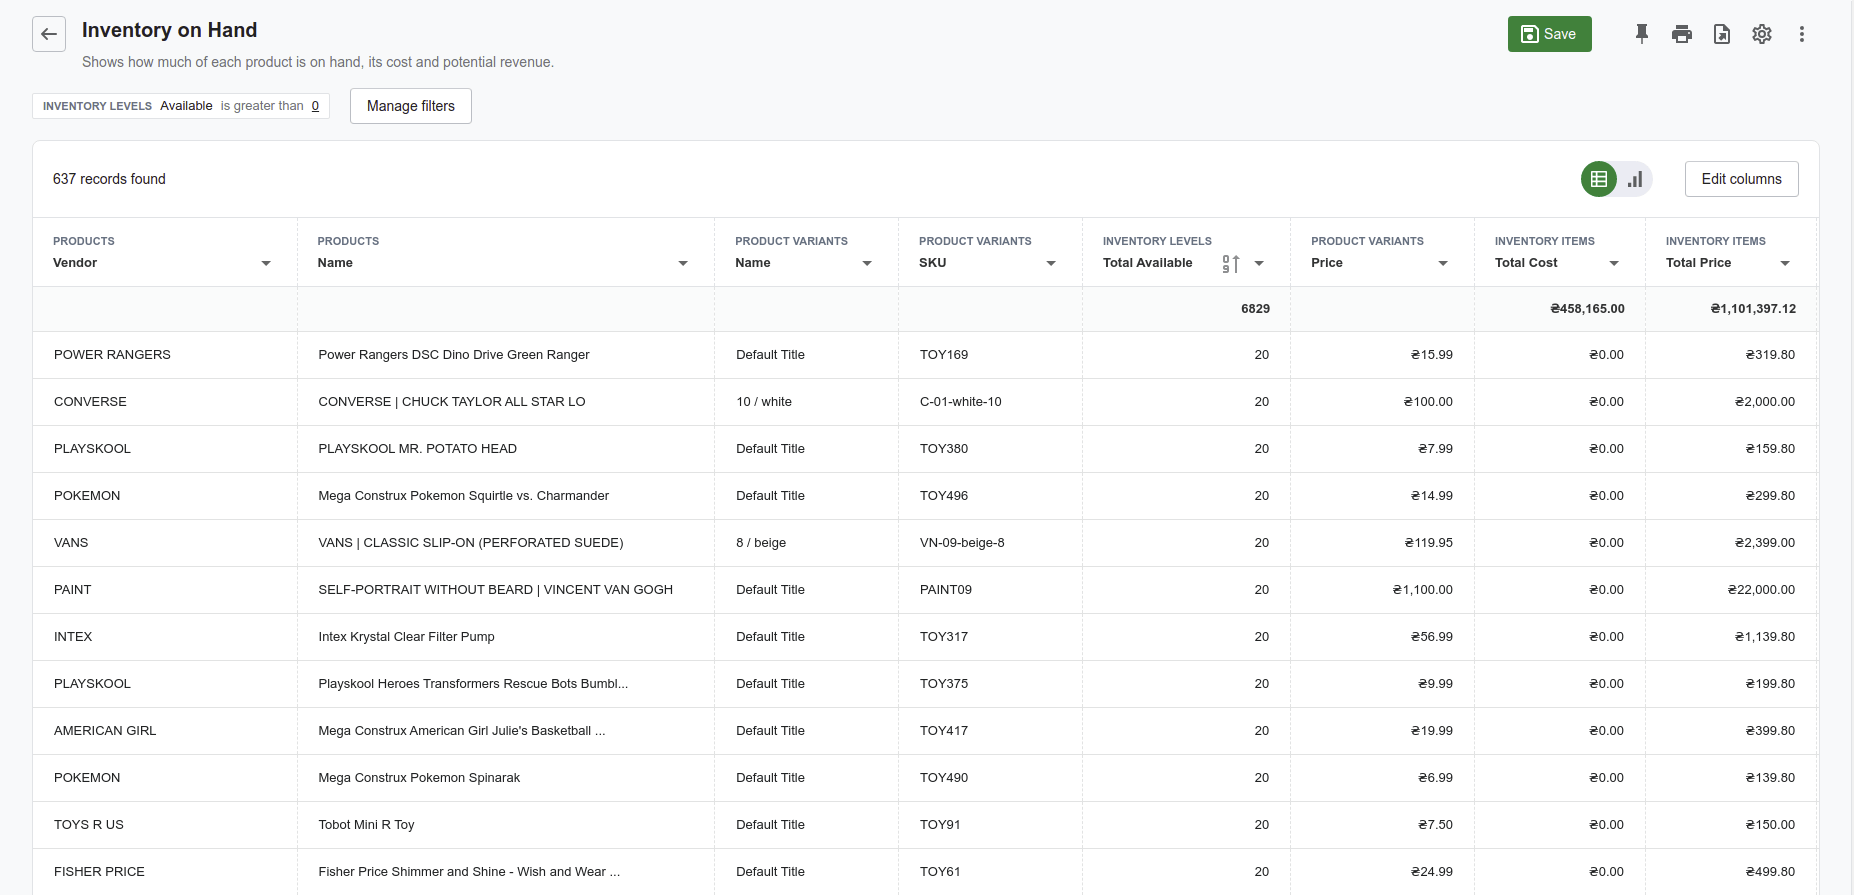
Thanks to this report, you can find Overstock Products - products with an unreasonably large quantity in stock.
For example, on average 1 pair of green sneakers is bought from you per month. Agree, in this case, it makes no sense to keep 200 pairs of green sneakers in stock. This stock will last more than 10 years.
Our team has specifically created several reports that allow you to manage your inventory.
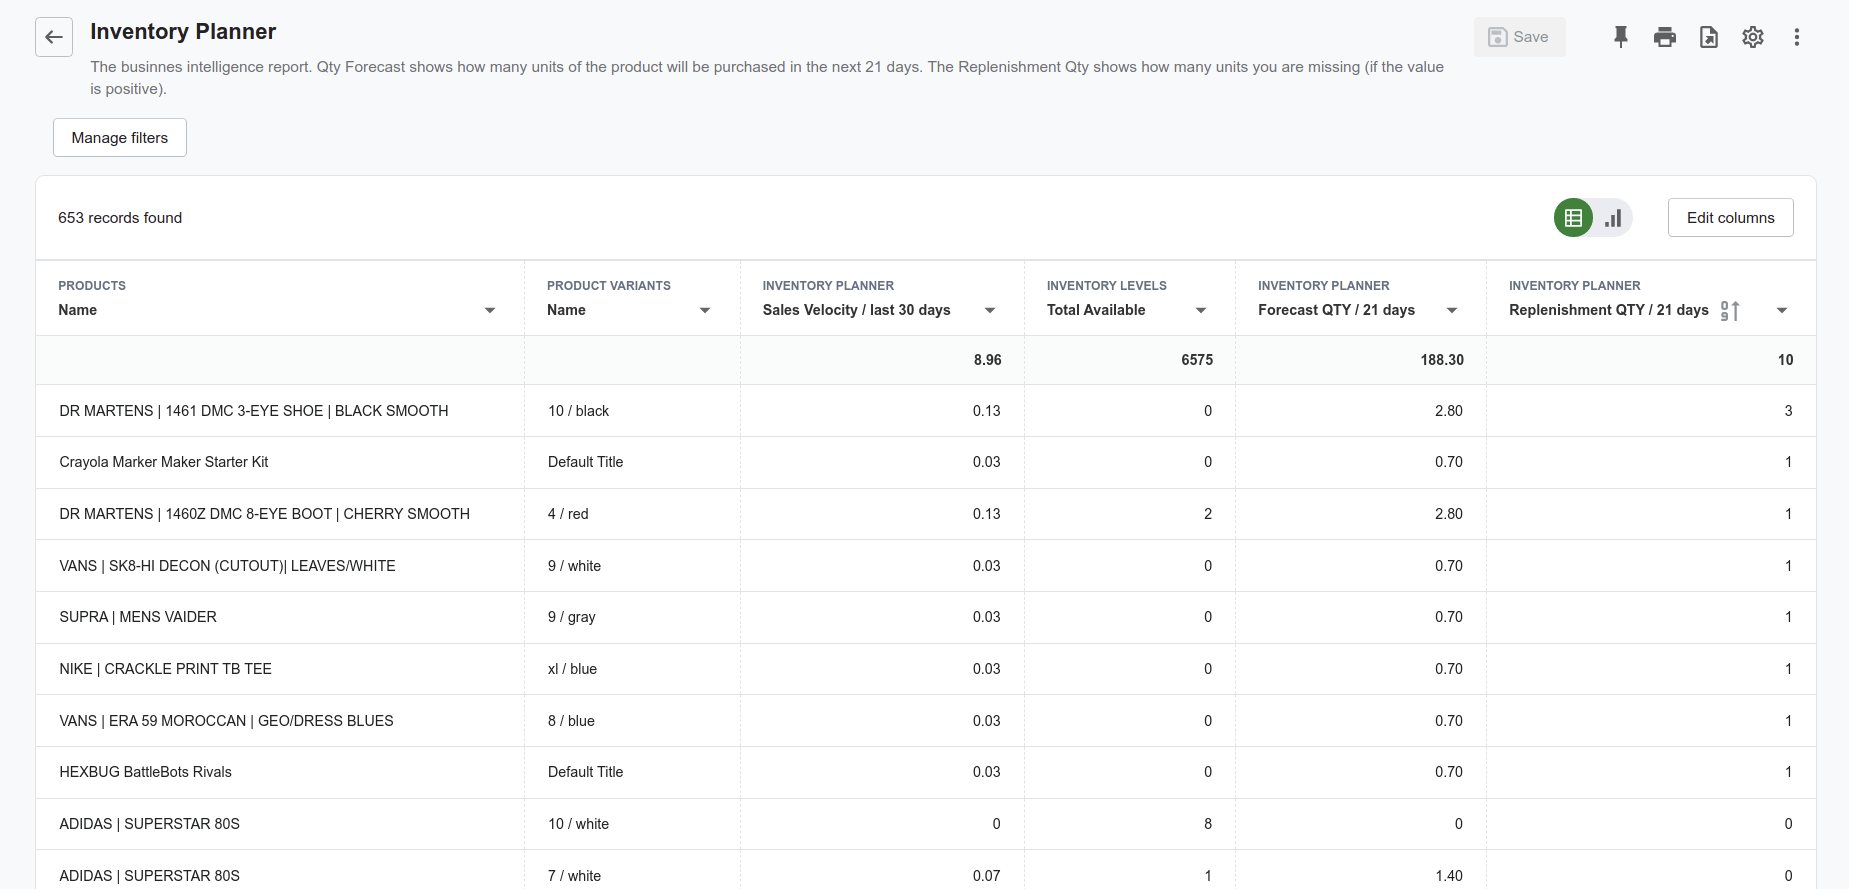
Inventory Planner report - based on the previous month's sales data, it will show what products you might be short of and calculate the amount you need to order extra.
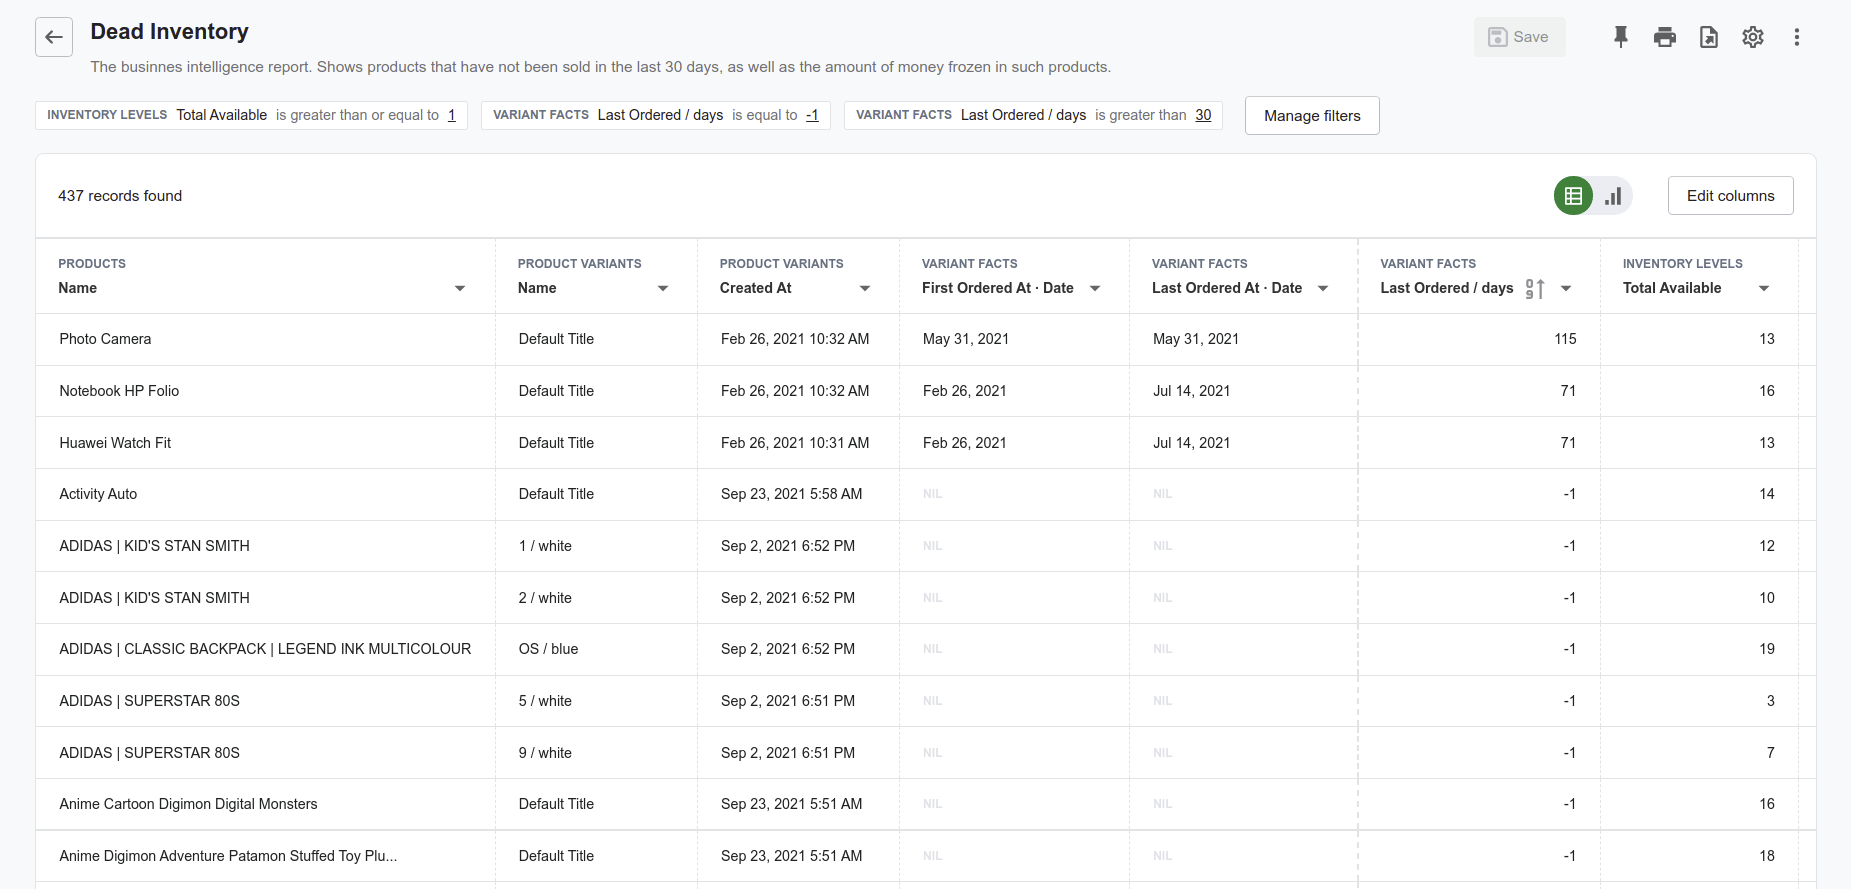
Another useful report is the dead inventory. It shows you products that are not selling well and also calculates how much money you have frozen on those products.
Metrics to estimate the store performance
Following key indicators (KPI) is significant as much as creating an effective strategy or setting a realistic but ambitious goals. Without an obvious sign that can be used to determine the performance of the business, wrongful decisions can be taken. They can depend on premonition, individual inclination, or conviction, or other wrong thoughts.
Sales reports in Shopify when built considering KPIs are capable of exact data depiction on performance the shop currently has and the customers. They are the tool to assist with settling on educated choices on key questions. There is no exclusive role of KPIs to evaluate the performance.
Yet after some period, as the KPIs were tracked quarter by quarter, the patterns and trends begin to emerge, which can be valuable and beneficial for anticipating future numbers of sales. And better sales reports Shopify can show an appropriate course of actions for the executive managers.
Average Order Value
A unit of normal measure of cash charged for some list of sold products can be calculated with one main parameter. This parameter is the average value of orders. It is calculated as the number of sales which is then mathematically divided by the amount of actually closed sales. This math operation is known for including the sum of taxes. Any values that were available in the form of discounts are also not left outside. Shopify total sales reports avoids including some of the parameters. For example, the Returns are excluded from the calculation.
Optimizing net revenues and development openings is possible when sales reports Shopify calculation depicts a higher number for the order in average. Nonetheless, do remember that such a number can become misdirecting in some situations. This can be a situation of customers who enroll in higher sales, however, there is a decline in the counted number of customers.
Gross Sales
This is the aggregate sum of all enlisted purchases inside a specific time span, excluding any expenses on discounts, shipping.
Using this figure that is typically referred to as Gross Sales one becomes totally capable of obtaining quick insights on sale data points. Such information can be valuable when examining Shopify reports total sales during a certain time premise, like one month. Alternatively, this time premise can be one quarter. This enables a storekeeper to check bottlenecks and limitations to the pipeline of trading, contrast data with competitors regarding total sales, and make required moves.
Net Sales
A calculation of an aggregate sum of all enrolled sales (typically this is Gross Sales) can be easily named as Net deals with some parameters taken off. These parameters are any Discounts or Returns.
A number that depicts the net financial quality of deals doesn't serve much as a tremendous net metric when it is utilized alone. Anyway when it is used close by Gross Sales, this permits highlighting the qualification between how much store is obtaining and the sum that left later after all installments.
Enormous contrasts between the Net and Gross numbers of sales are bad pointers for any online business on the grounds that in those cases a considerable amount of possible revenue is lost. It can be lost into either Discounts or Refunds.
The rate of returning and repeat shoppers
A fraction of shoppers that is displayed as a percentage of people who have spent money not only for one shopping deal is represented in the summary. It is presented as the Repeat Customer Rate.
Although the pace of people who are willing to make repeat purchases will eventually be dictated by the product selling aspect and the degree of customer fulfillment, the most commonplace number for this boundary is near 25-30% from the total number of shoppers.
Alex Schultz, the vice president of the Facebook's growth department, upholds this point by saying: "Assuming a store can have 20-30% of clients returning each month and completing a purchase, then the business ought to do very well."
Customer Lifetime Value (CLV)
This data parameter recognizes the importance of a shopper to the organization throughout the brand commitment.
Various organizations dismiss this importance of optimizing every deal, hence taking a foolish working system. Undoubtedly that noticing freshly emerged clients is at this point imperative for online trade advancement, intensifying the existing usage timespan of already available clients is correspondingly fundamental for any firm to keep a powerful trade system. A higher value of a timeframe if it can be achieved for some accounts shows finer sales execution and provides additional beneficial openings a merchant can think of.
Customer Acquisition Cost (CAC)
The financial drawback that a firm has to bear with intentions of transforming a logical prospect into a devoted customer is alluded to as the finances on acquisition. At the end of the day, CAC is the how much money the company used for delivering sales and related marketing support with the expectation to persuade a customer to make a purchase.
Client Acquisition Costs are an obvious sign of the organization's future exhibition. By knowing CAC, a payback period can be decided and enhanced. The goal ought to be to decrease CAC, which converts to burning through money more efficiently and getting more significant yields after all.
Inventory Levels
KPIs set on Stock Levels let a merchant know the Stock amount available, how long it is not selling, and how rapidly it is selling. These metrics help a merchant in deciding how to make operations more effective while keeping customers satisfied.
