Make educated decisions based on the data from your store.
If the owner of an online store needs to intrigue investors, draw in more financial backers, highlight the brand image, connect with employees, or simply file a report with government authorities, an annual report is a tool to use.
It is a document with multiple data points integrated into one, conveniently analyzing the activity of the business in the preceding year. This document has been a regularly reporting component for a business for almost a century. Depending on a country's specifics, the report compilation and the data contained can vary.
So, precisely what is an annual report? Organizations, including those in the sector of online commerce, generate various sorts of yearly reports. Each sort of yearly report that can be generated is planned to shed light on the unmistakable objective a business wants to solve with this type of reports.
A conventional yearly report is an extensive outline of all achievements and financial statements of the business from the former financial year. It is created consistently, and its primary goal is to inform investors, financial backers, partners, employees, and others about the current financial status and provide the vision for what's to come.
Today, yearly reports are frequently utilized as marketing tools to impress all who are already involved in the business and attract new ones. Often, an annual report is required to be published on the company's website. In some cases, a shopify audited annual report may be required.
There are no strict demands for the content of the ordinary yearly report for a business organization. Typically, such report includes a letter from the organization CEO, monetary information, operations and results, market segment data, plans for new products, additional information, and innovative ideas.
Depending on the particular business and its size, the annual report may vary significantly. It can contain from several pages to hundreds of pages.
Typically, the yearly report contains key data on an organization's financial status, and this document can be utilized to measure: an organization's ability to pay its obligations, growth over different years, how much revenue is retained by an organization to grow its operations, the proportion of operational expenses to generated revenue.
The annual report also determines if the information aligns with the accounting standards (GAAP).
Regarding mutual funds, the annual report is a necessary document made available to investors on a yearly basis. It discloses specific aspects of a mutual fund's operations and financial conditions. In contrast to corporate annual reports, mutual fund annual reports are best described as "plain vanilla".
The annual report may be presented in various forms, with the most suitable one determined by the business needs.
The forward portion of the document often contains a significant mix of illustrations, photographs, and an accompanying story, all of which recount the company's activities over the previous year and may also make forecasts about the future of the company. The back part of the report contains detailed financial and operational information.
The primary audience of the annual report are essentially the investors of the business. They use the report to gain information on how the organization is performing, what its operations and future are.
At the same time, the annual report may be of interest to the employees and clients of the business.
Annual report for store staff
The yearly report is an extraordinary way for store workers to get more familiar with the brand and its goals. They can go through a yearly report to perceive what different projects and initiatives the organization has invested in.
Annual report for store clients
The yearly report is a way for a brand to present itself to its customers in the most ideal light. Organizations can showcase the qualities that set them apart from competitors.
Businesses can use the yearly report to discuss the types of suppliers and manufacturers they work with, how and where materials are sourced, the quality of their products, their impact on the environment, etc.
Shopify gathers every available data when something happens in your store. It can be, for example, a client who makes a purchase or interacts with the store in some other way.
For activities in your store, Shopify carefully notes down each detail and provides store owners and staff tools to look at that data from different angles through Shopify reports.
Some of the reports are accessible out of the box in the dashboard of the Shopify store, and others can be created independently when needed. With the abundance of data available to you in your store, it would be a disadvantage not to utilize it for your potential benefit.
For any online store, one of the most valuable groups of reports is reports on sales. It gives significant information on sales and products, provides clues about the purchasing preferences of shoppers. Those insights depend on a particular data analyzing model that is relevant to your shop. Sales reports in Shopify include the following list:
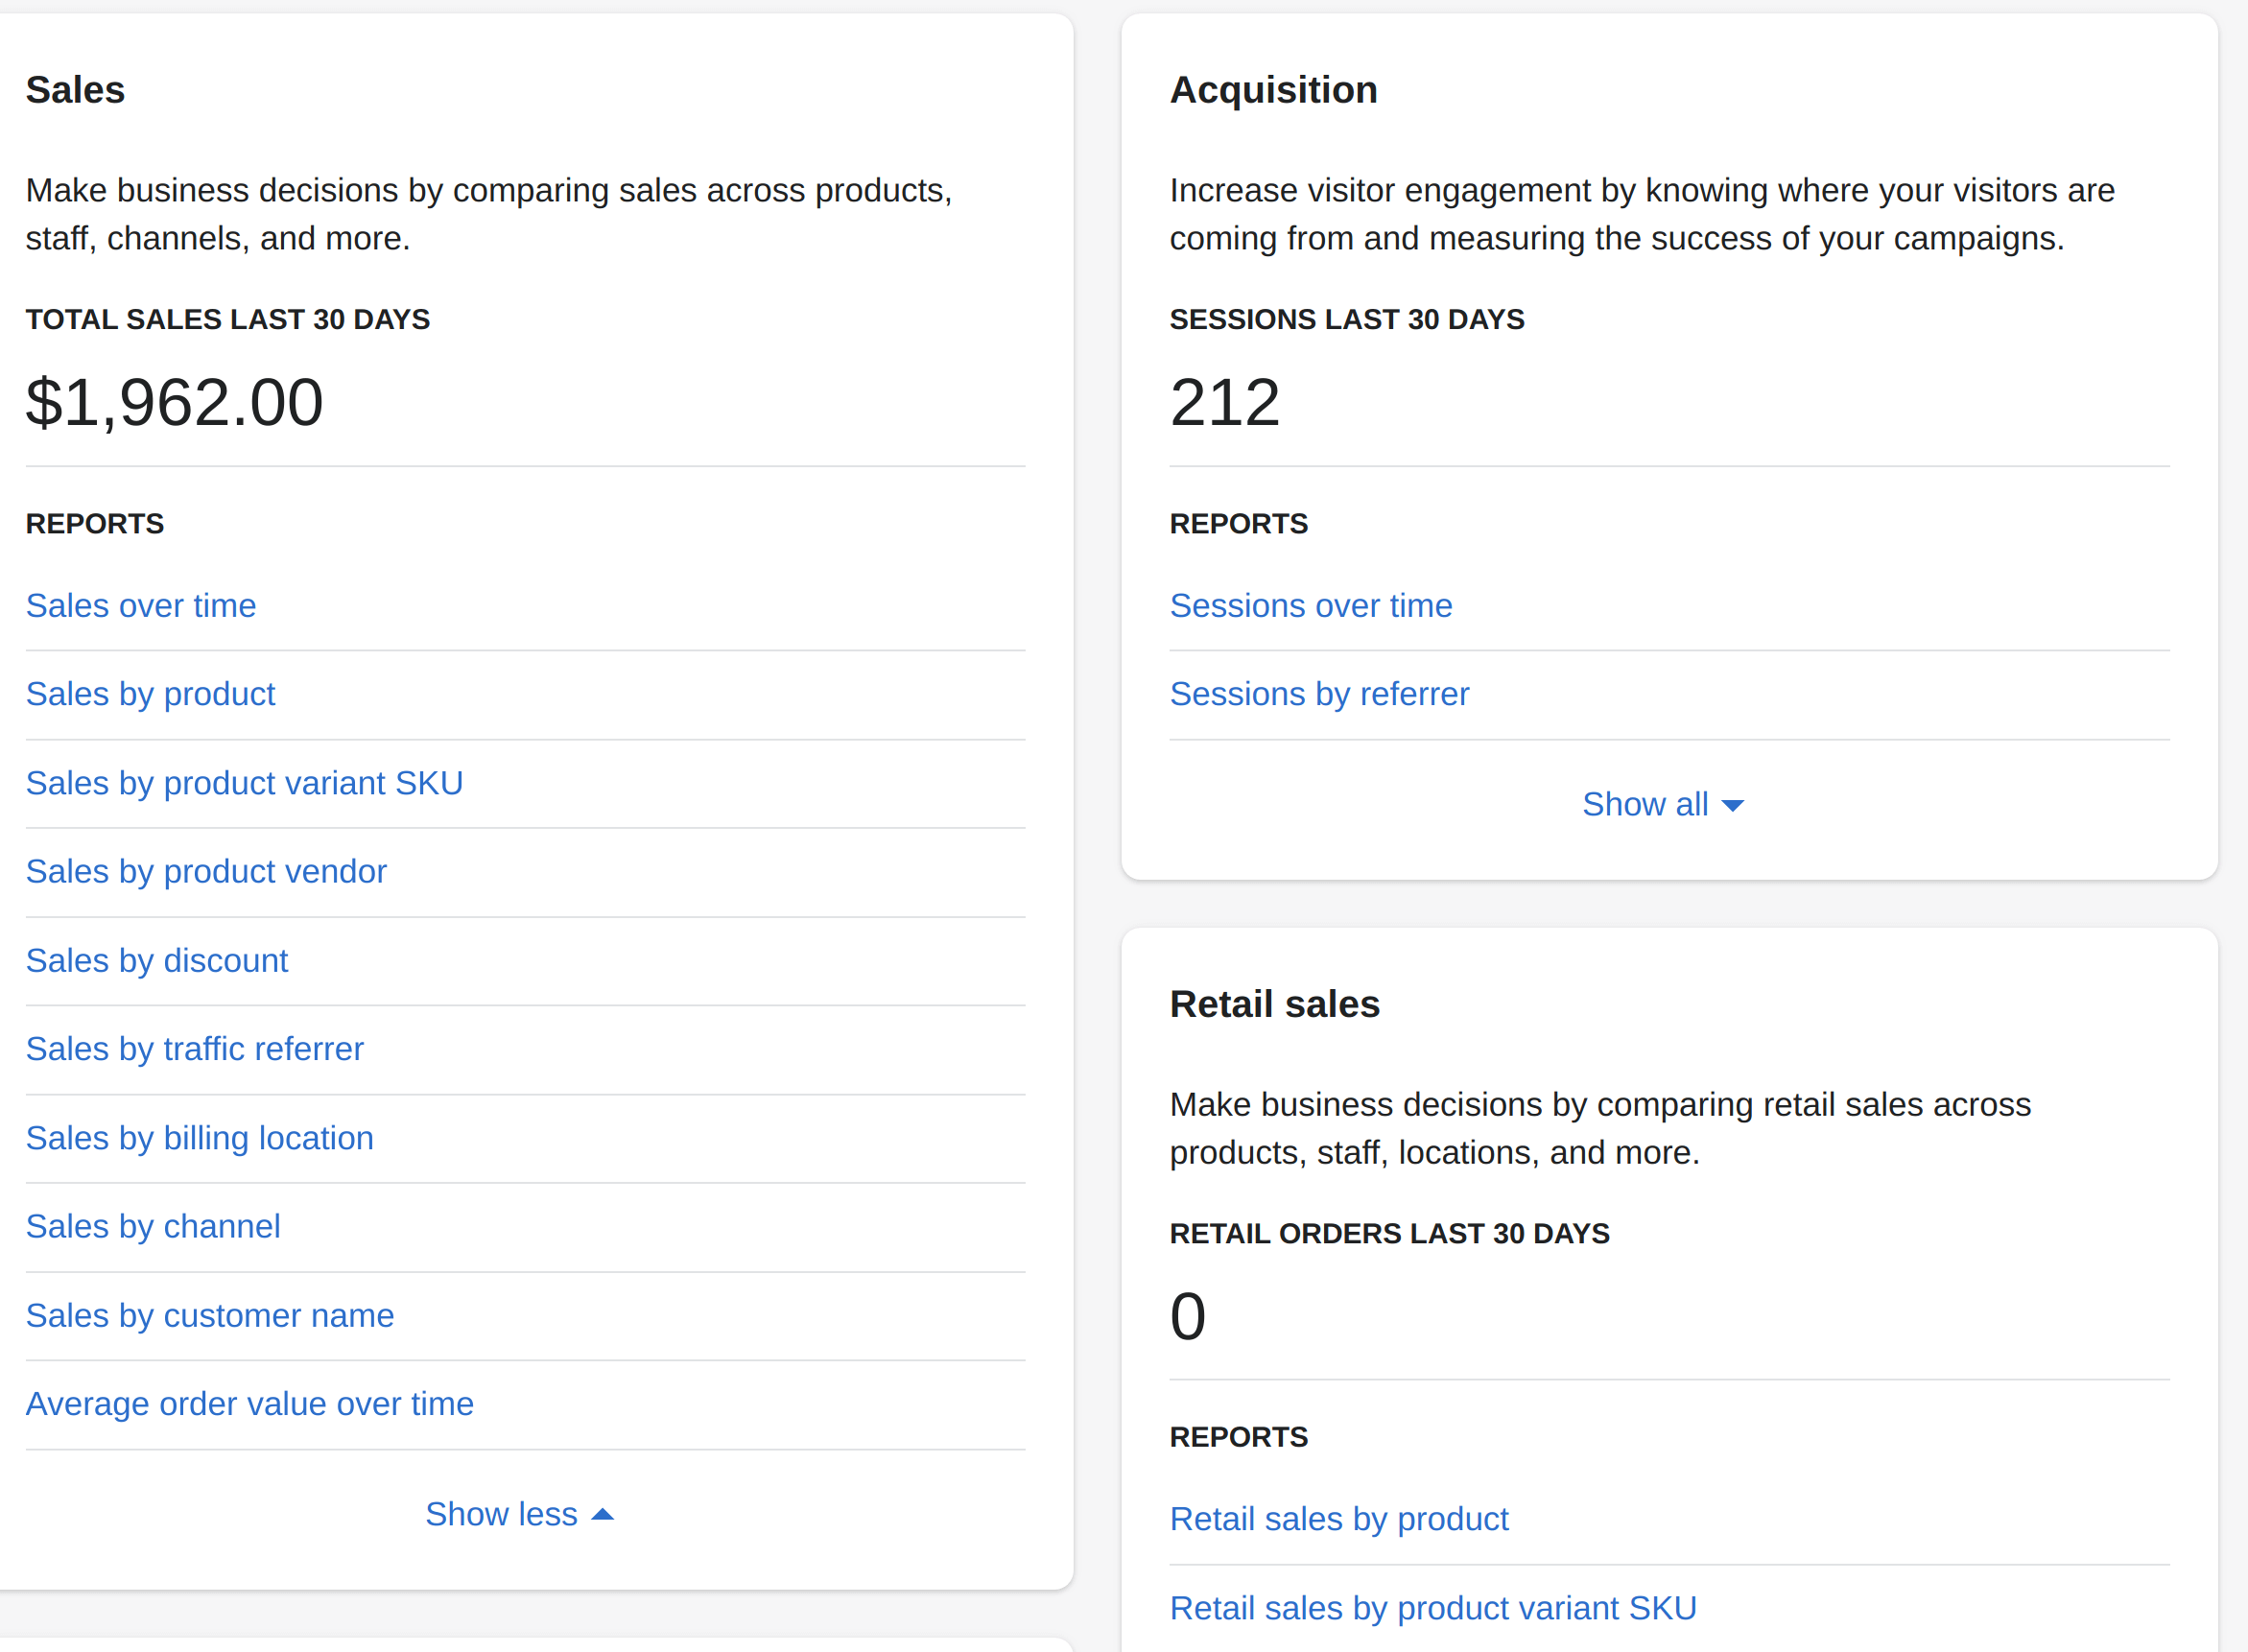
The sales over time report provided by the default Shopify reporting tool will give you a monetary outline. It will also show you the number of orders your store registered, the number of areas you've gathered sales from, and the number of financial transactions you had.
The Sales over time report available in Shopify shows the quantity of orders and the total sales that a store has made over time. You can choose a unit of time in the "Group by" drop-down menu to control how the information is assembled. The data can be assembled by day, by month, by year.
Shopify online annual report is usually used when summing up the results of the current year or when analyzing and comparing sales for the previous year in order to build plans for the current one.
When you open a report, its information is displayed for a default date range. For instance, in the case of an annual report, it is a year. Keep in mind that the default range for certain reports is a month, and change it to a year for the annual report. The time range that you set for the report is kept as the default until you change it once more.
Below is an example of the Sales over time report for a time range within a year. To generate such a Shopify annual report from the data available in your store, you simply need to go to the admin panel of your store on Shopify. Then, in the sidebar on the left, select Analytics > Reports > Sales Over Time.
Next, you need to specify the time range in the filter by dates or by selecting a standard time interval, for example, last year. After this, select the data grouping. You may display the report for each day within the specified time range or group it by month, quarter, day of the week, etc.
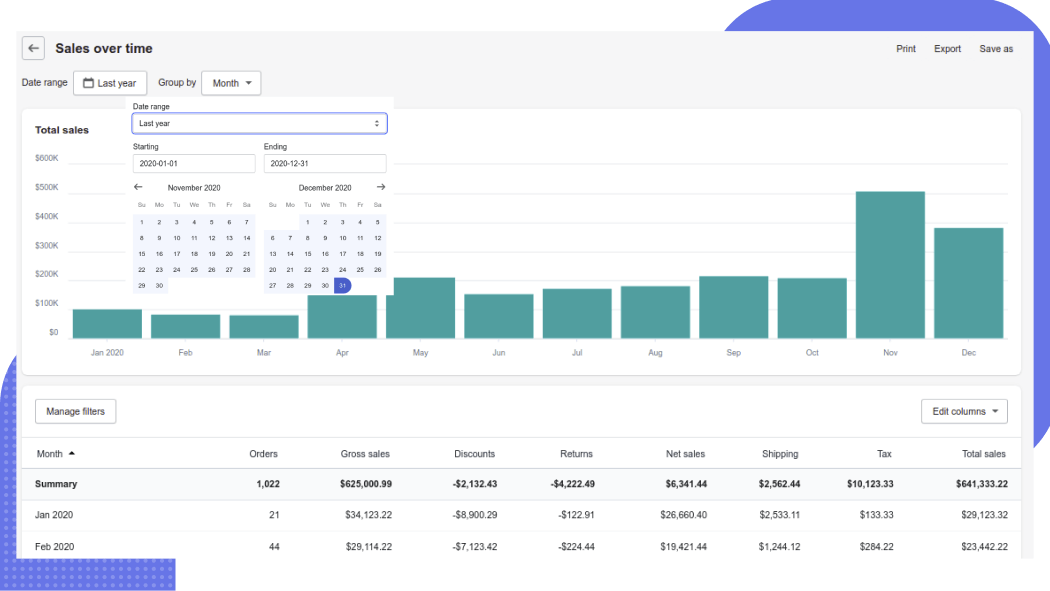
Below the chart, you will find a data table that is used for the report. Apply filters to get rid of unnecessary information and select additional columns to add more data you would like to see in the report.
You can add columns on orders, gross and net sales, discounts, returns, taxes, total sales, fulfillment and payment status, cancelled orders, average order value, and some other data columns.
When you have fully finished forming the annual report, Shopify provides you with functions to print it, export it in a CSV format, or save it as a template for a custom report.
Using a third-party reporting app in your store brings you several key benefits. First of all, in default Shopify stores, Shopify Lite and Basic Shopify plans have no access to Sales reports.
The Advanced reports app by Mipler provides a full package of reports regardless of the subscription plan a Shopify store uses. Hence, the store owner can easily get access to the annual report.
Default Shopify reporting dashboards are incredible tools when you're at the beginning of your online ecommerce endeavor, however, they can limit your abilities in the long run.
Shopify standard reporting tools don't give an upper hand in the competition since those prepackaged reports are accessible in a great number of other Shopify stores. This means they all are basing their management and decisions around similar stock insights.
In the Advanced Reports app, a similar report for annual data analysis is called Sales Overview. It also allows you to build graphs using data from the report.
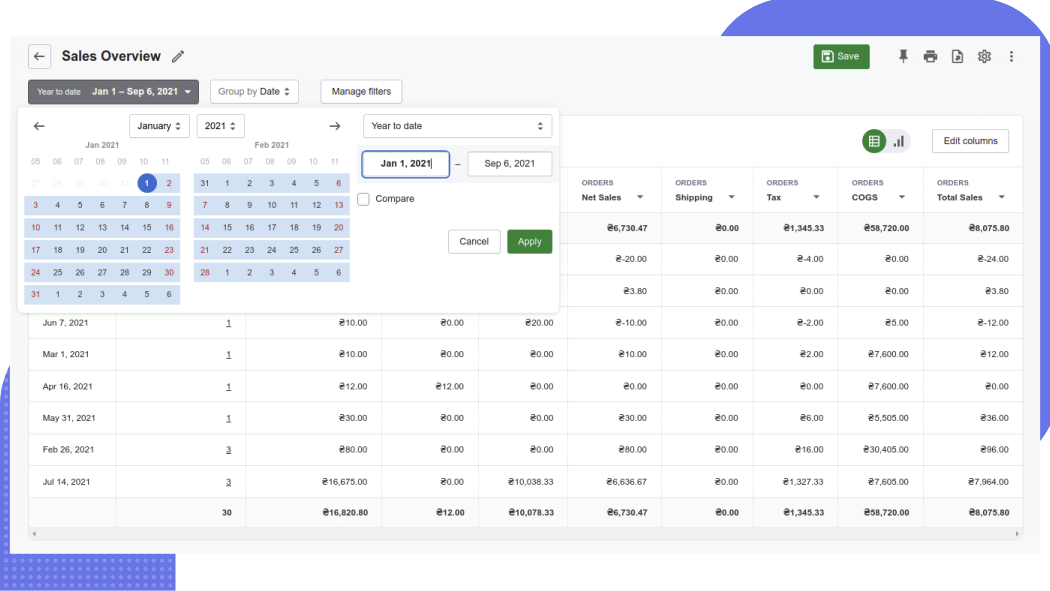
In order to get access to reports built by the Advanced Reports app, in the admin panel of Shopify, on the left part of the screen, navigate to Apps > Advanced Reports > Sales. In the list of all available sales reports, select the Sales Overview report.
Basic usage of the report is the same as the default Shopify Sales Over Time report. You need to specify a time range, select the data grouping option, apply filters, add data columns.
The Advanced Reports app provides enhanced visualization for the available data when compared to the default Shopify report. In addition to the column chart, you can choose line, bar, area, pie, scalar data representation.
Additionally, you have more possibilities for data export. You can export the annual sales report as Microsoft Excel, PDF, HTML web page, CSV file, Google Sheets.