Suppliers are the same sellers as you. Only their customers are not people, but businesses. And just like online stores, there may be several competitors in a certain market segment. In such an interesting situation, you play two roles: a customer and a filter.
Since you buy supplies from suppliers, you are a customer and can determine whether you are satisfied with the quality of the goods, prices, and speed of delivery. But the opinion of your customers is much more important, they are end consumers, so firstly you need to focus on their preferences. And nothing shows the advantage of a supplier so well as the sales of its products. And among all Shopify Reports, Sales by Vendor Report will best help determine which of your suppliers is a more profitable partner.
Why the Sales by Vendor Report on Shopify is important
This summary of sales shows the breakdown of revenue and expenses for products on the level of brands which your store sells. Use the functionality of this Shopify’s reporting tool to compare the costs and revenue across brands in your store to understand better which vendor brings the most profits.
Additionally, use the summary to see progressions of sales key indicators and contrast current data with earlier time periods. The default configuration of this report offers data on general sales of products split by its vendors. The information is offered by displaying such columns as gross sales, returns, discounts, net quantity, total sales.
When applying filters to the summary output, the data can be made more representative of your needs. For example, you can add product names, SKUs, variant names. Such information can be useful for inventory planning and marketing purposes.
Benefits of Shopify Vendor Sales Reporting
A report is a document that collects information based on certain criteria about some aspect of your store. If you use a report that groups your sales by supplier, you can get some unexpected bonuses for the store.
Of course, first, it is immediately clear which supplier is more profitable for you to work with. This is especially important if the suppliers work in the same market segment.
Knowing who to cooperate with, you can purchase products that have a faster turnover and place them in the warehouse. In this case, your investments will turn over faster and your profits will grow.
Another advantage is that vendor reporting provides data for negotiating to reduce purchase prices. You have specific facts about the profitability of a particular supplier. On this basis, you can build not only a negotiation strategy, but also a marketing strategy. By highlighting the suppliers you need, you can maintain a balance in sales and inventory.
How the Shopify Vendor Reporting Helps You
The most important thing this report will help you understand is the answers to questions that are very important for the future development of the store:
- What is the net quantity of items sold for each vendor within the specified time period?
- See what brand brings the most sales and which one has the least sales?
- What are the key sales indicators (total, gross, net sales) for each brand within the given time range?
- How many refunds does each brand have?
- What vendors are mostly purchased by customers with discounts?
- What sums of taxes and shipping fees are referred to each brand?
The data displayed in the report will show which suppliers are worth continuing to cooperate with and which ones are not. The better the indicators, the more reliable the partner. If you are not satisfied with the indicators, then you can intensify marketing actions regarding one of the products. Offer discounts to customers, or sell products in pairs.
Create Shopify Vendor Reports with Mipler
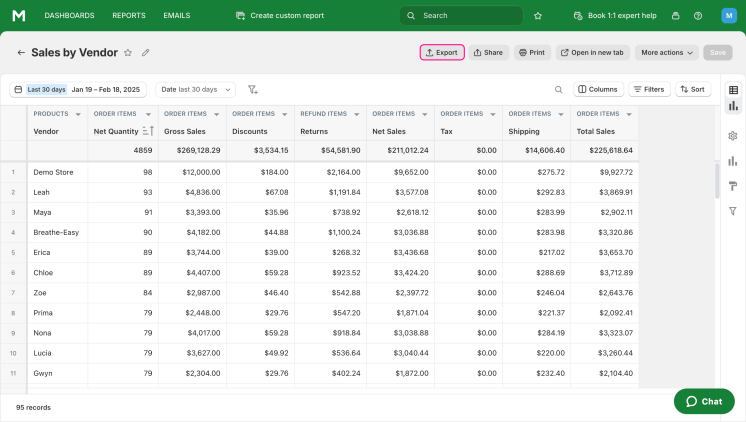
Mipler already has a basic report for comparing Shopify product vendors. It is called Shopify Sales by Vendor Report. It contains the following information:
- Vendor;
- Net Quantity;
- Gross Sales;
- Discounts;
- Returns;
- Net Sales;
- Tax;
- Shipping;
- Total Sales.

Just as you can add additional information to other Shopify Sales Reports, the vendor report on Shopify can be improved by adding other columns or filters.
You can also use other similar reports that will give you additional information about vendors. Sales by Vendor > Product > Variant Report compares the sales performance of different product variants of each manufacturer. Also, at the request of our clients, we have made custom reports that highlight the sales results of specific product variants of only one vendor.
Build and Automate Your Shopify Sales by Variant Reports to Optimize Your Store
Mipler can offer you ways to both optimize some processes in the store using the report and automate work with the report itself. To save your time searching and viewing reports, you can set up reports to be sent by email. Some reports are worth reviewing daily, but Sales by Variant Report will be enough to look at once a month.
To automate calculations and data analysis in the report, you can add a column, set a filter, or our team can develop your own for your needs.
In order to optimize the process of sharing information within your team, you can upload all the necessary reports to Google Sheets. Then you can make changes manually and provide access to the reports to many people.
Important
Shopify vendor analysis reports give you the basis for effectively managing your inventory and collaborating with profitable suppliers. Your store's reputation and success depend on your cooperation decisions.
Therefore, it is worth paying attention to whether the sales of a particular supplier's products are high, whether the quality of the goods they sell is good, and whether their products bring you the expected profit.
FAQ
What is Shopify Sales by Vendor Reports?
This report provides information about the sales performance of your products grouped by their vendors. It helps store owners track the profit from cooperation with a code vendor, sales volume, and popularity of their products.
Why Shopify sales Vendor Reporting is important?
Because only this report will help you:
- Identify suppliers with whom it is profitable to cooperate;
- See the sales results of each supplier's products;
- Get arguments for changing the terms of cooperation with unprofitable suppliers;
- Optimize purchases.
What data does Sales by Vendor Report contain?
This report contains information about:
- Vendor;
- Net Quantity;
- Gross Sales;
- Discounts;
- Returns;
- Net Sales;
- Tax;
- Shipping;
- Total Sales.
If this information is not enough, you can add the necessary columns, filter the information using filters. Also, by contacting our support service, you can develop a customized report for your needs.
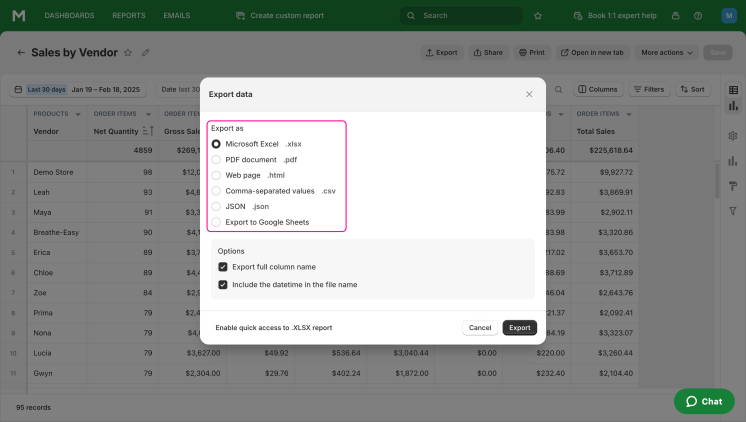
How to export Shopify Sales by Vendor Report from Mipler app?
- Open Sales by Vendor Report
- Choose “Export” button:
- Choose file format to download report: