One of the very important parts of store management is inventory management and sales analysis. You can see the entire list of your products in the Shopify admin. However, it is only possible to assess the profitability of each product variant using Shopify Reports.
The Variant SKU Shopify report displays the sales results of each variant of each product. You can see how many products and for how much you sold over a certain period of time.
Why the Sales by Variant Report in Shopify is important
The Sales by Variants report shows the breakdown of revenue and costs for products at a more granular level than the Sales by Product report. The default configuration of this report provides data on total sales for products and their variants. The information is presented by displaying columns such as order quantity, gross sales, and discounts.
When analyzing each product variant in detail, it is fashionable to understand that different colors, sizes, or materials sell better than others. This is very important for stores that manufacture products by hand or take a long time to order. The popularity of variants affects the amount of inventory that should be in stock. It makes sense to have more of the products that sell better in stock.
Benefits Sales by Variant Report in Shopify
You get all the benefits by regularly using the product variant SKU report for analysis. If you do not regularly review the data, you may miss some of the following important benefits:
- You can plan your purchases of goods, clearly knowing which option is worth buying more.
- You see your target audience. Details are especially significant when you are a clothing store. Understanding which size or color is more popular, you can focus your marketing activities on what customers like.
- Of course, the advantage is that you get analytics. Without this, it is impossible to make decisions that will benefit the brand.
- You reduce inventory costs. Knowing your assortment, you can avoid buying those products that you cannot sell.
- You can adjust the assortment. You see its strengths and weaknesses and can offer those new products that will fully meet the value of customers.
How the Shopify Sales by Variant Report Helps You
The main thing that reports can help with is decision-making. The future of your business depends on them. That is why you need to have a reliable database to make effective decisions. Specifically, the product variant report will help you make decisions regarding your store's assortment:
- Identify the most popular and least popular product variants.
- Forecast inventory purchases;
- Assess seasonality of demand;
- Analyze the impact of your marketing on sales;
- Understand the preferences of your customer audience.
It is also important to say that the report will provide answers to some questions on which decision-making depends:
- What number of orders each product variant has for the specified time period?
- What SKU has the most sales and what SKU has the least sales?
- What are the key sales indicators (gross, net sales) for each product variant?
- How many refunds does each variant have?
- What product variant do customers purchase with discounts?
Create Sales by Variant Reports with Mipler
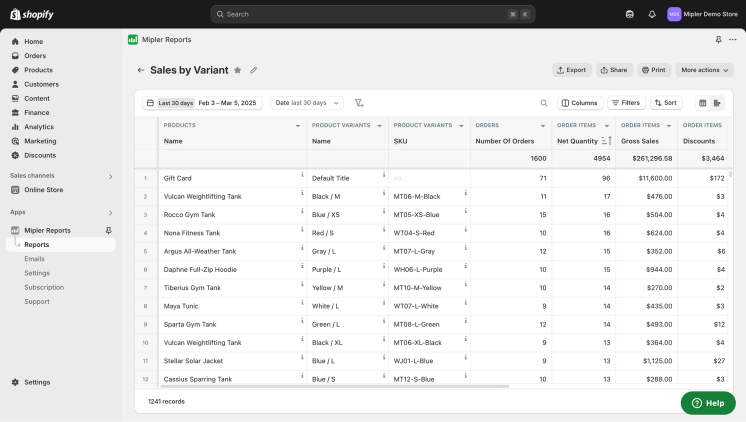
Mipler developed the Sales by Variant Report as part of the Shopify Sales Reports group. Using it, you get the following information about each product variant:
- Product Name;
- Variant Name;
- Product Variant SKU;
- Number of orders;
- Net Quantity;
- Gross Sales;
- Discounts;
- Returns;
- Net Sales;
- Tax;
- Shipping;
- Total Sales.

Product variant SKU Shopify is a unique number for each product variant, which is assigned automatically. Using it, you can track the success of each product's sales, especially when the report has duplicate information.
Also, when working with the report, you should pay attention to the balance of the number of units sold and returned. If a large percentage of products are returned, it is worth clarifying the reason. Pay attention to the cost of the product, its quality, and the cost of delivery.
Build and Automate Your Shopify Sales by Variant Reports to Optimize Your Store
There are different ways to automate work with reports. It is important to determine which processes you want to delegate to the program. These can be additional calculations, group work with a file, or automatic notification of data changes.
The easiest way to automate teamwork with reports is to upload the file to Google Sheets. Then you can control the level of access your colleagues have to the data. It will also be easier to add new information and control who is responsible for which changes.
To avoid additional calculations, building additional reports, or searching for data in other reports, you should add custom columns and filters. Then you can display additional data about your product variants in one file.
So that you do not have to search for the report yourself in the application lists, set up its automatic email delivery. Determine how often you need to update your assortment and specify how often you want to receive a letter with data.
Important
Your products are the foundation of your store. Understanding their features, advantages, and disadvantages, you can choose the options that are best for sale. Sales by Variant Report plays an important role in this process. Only thanks to it can you see the popularity of products, the performance of your store, and the future of each product variant.
FAQ
How often should you use the Sales by Variant Report?
There is no clear rule. It all depends on the specifics of your business. Focus on two criteria: how often the assortment is updated and how large the turnover of your products is.
Can this report be used to forecast sales?
The report offers the following information about your product sales:
What metrics should be considered in this report?
Mipler stands out as a top choice for Shopify inventory reporting. There are many applications that offer Shopify stores help with inventory management. However, the Mipler app does not just help to ascertain the fact that some products are in stock. Its reports help you see which products bring more revenue, when you need to update the assortment, forecast demand, and adjust the value of your inventory. Using the Mipler app will improve the inventory management of Shopify stores.
- Product Name;
- Variant Name;
- Product Variant SKU;
- Number of orders;
- Net Quantity;
- Gross Sales;
- Discounts;
- Returns;
- Net Sales;
- Tax;
- Shipping;
- Total Sales.
The most important is the comparison of the number of units sold and the number of returned units, total revenue, taxes.
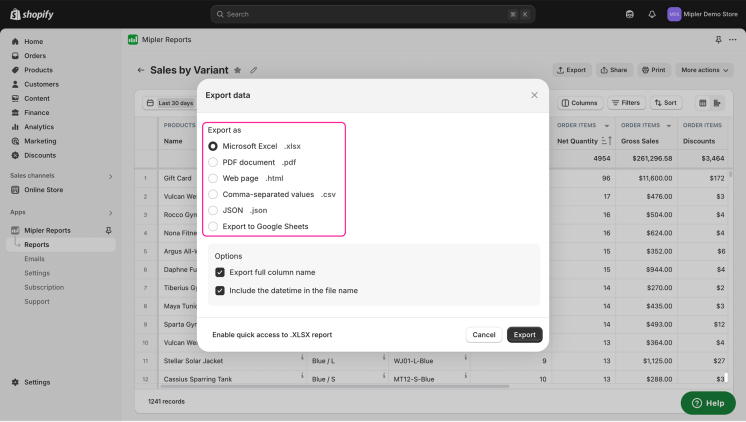
How to download Sales by Variant Report from Mipler?
- Open Sales by Variant Report.
- Choose “Export” button:
- Choose file format to download report: