The evaluation of sales data to product type on Shopify report helps store owners reach maximum store potential. A detailed view of revenue breakdown by product categories gained from the Shopify Sales by Product Type Report enables store owners to make their choices based on data. You can improve your inventory strategy combined with marketing plans and total sales achievement through a detailed analysis of this report.
Why Shopify Sales by Product Type Report is Important
Tracking Shopify merchant sales by product categories allows them to see customer preferences for better inventory management and strategic marketing choices. The analysis of revenue sources based on product type provides business owners with an understanding of their profitable products and areas for improvement.
Key Reasons to Use This Report:
- Identify Best-Selling Product Types - Determine the product types that generate maximum sales volumes in the market.
- Better pull of products - This tool allows you to identify products with the lowest revenue, which helps you create future promotional plans to boost user engagement and revenue.
- Enhance Marketing Campaigns - The marketing promotion strategy should focus on topping up high-performing product categories to improve upcoming promos.
- Improve Supplier Negotiations - Supplier negotiations will improve when you enable product types in Shopify report knowledge about what products generate the greatest revenue.
- Boost Customer Satisfaction - Popular product types in your store lead to better customer satisfaction since they make quicker purchases.

Benefits of the Sales by Product Type Report on Shopify
Through this report, businesses could simplify their operations and get maximum profitability achievements. Product type historical data provides stores with better predictions of future market demands.
Your decision to effectively manage your budget using Shopify Sales Reports allows you to optimize promotional techniques in marketing and discover what products your target audience prefers the most.
Previous sales data allow businesses to develop preparations for both times of peak and minimal sales, which improves seasonal planning strategies. Budget management helps optimize marketing promotions and detects preferred product categories among customers to improve business understanding of consumer needs.
How Shopify Product Type Management Helps You
Managing Product Types in Shopify
Accurate use of the Shopify Product Type Report depends completely on your product categorization structure. You should begin from the Shopify Admin → Products section to assign Product Types that will enhance your segmentation abilities. Regular check of your store data creates accurate reports which prevent data misalignments.
Common Product Type Challenges
Many store owners face issues related to product classification. Here are some common challenges and how the Shopify Product Type Report helps resolve them:
- Misclassification of Products
Issue: Misclassification of products results in incorrect reporting and insights.
Solution: The Shopify Product Type Report allows you to detect incorrect classifications so you can achieve more accurate analysis data.
- Standardization Issues
Issue: Inaccurate product analytics and reports taken from inconsistent naming conventions could make standardization issues in your database.
Solution: You can guarantee similarity of product naming conventions across all reports through the use of this report.
- Problems with Product Filtering in Shopify Reports
Issue: Proper classification prevents issues with product filtering in your Shopify Reports
Solution: Product Type Report delivers quick and direct access to specific product data after users define correct product type parameters.
- Loss of Valuable Sales Insights
Issue: Poor organization of data prevents valuable sales trends from becoming visible to users.
Solution: A properly formatted Shopify Manage Product Types report enables the discovery of important shopping trends, which leads to better inventory decisions.
Create a Shopify Sales by Product Type Report with Mipler
Mipler simplifies Shopify reporting with powerful customization options. Follow these steps:
- Log in to Mipler
- Select Sales by Product Type
- Apply Filters by product type, net quantity, gross sales, taxes, etc.
- Export Data by Download reports in CSV or integrate with Google Sheets
Automate Your Shopify Sales by Product Type Report to Optimize Your Store
Automation ensures that you always have updated reports without manual effort.
With Mipler you can:
- Receive email-based insights at selected time periods.
- The system includes a data integration process which enables the export of reports to Google Sheets together with additional platforms.
- Operate several stores and achieve better understanding through gathering automated reports across all their stores.
- Advanced Segmentation can organize your product categories based on total sales, shipping, tax calculations and discount values.

Important
The constant use of Shopify product types report allows store owners to achieve higher goals while boosting their business performance. With correct product tagging using Mipler's automation tools and Shopify Sales by Product Report, you can generate decisions which drive higher revenue. Your marketing approaches together with inventory management will become more effective by focusing on products that perform best.
FAQ
How often should I check the Shopify Sales by Product Type Report?
The analysis of this report should occur weekly or monthly for tracking performance trends. Businesses which generate high-volume sales need to conduct daily sales performance audits.
Can I customize the Shopify Product Types Report?
Mipler allows total customization across date ranges, filters, many export options and scheduling of reports to different formats. Mipler lets you merge multiple reports, so you can gain extended visualization of data.
What is the difference between Shopify Product Type and Product Category?
Product Type it's a classification that merchants define themselves, and Product Category works as a basic standard for all Shopify stores. Getting accurate reporting results requires working with both of them. The value of Product Type is in tracking information internally yet Product Category delivers standardized classification for Shopify's external network.
How do I automate Shopify Product Type Reports?
The scheduling tool in Mipler allows you to choose a time period for your email updates or sheet export to Google Sheets. Mipler scheduling function automatically provides important product performance updates with no need for manual work.
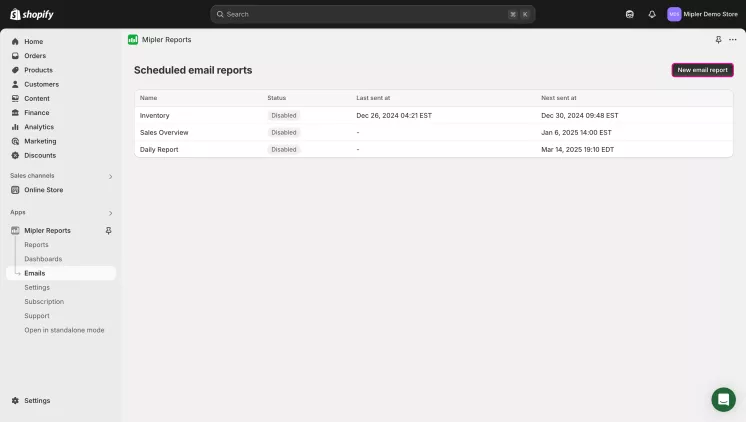
- Open Mipler - Emails and click on "New email report"
- Name your email report, set time period when you'll receive these reports and select reports
which you want to receive
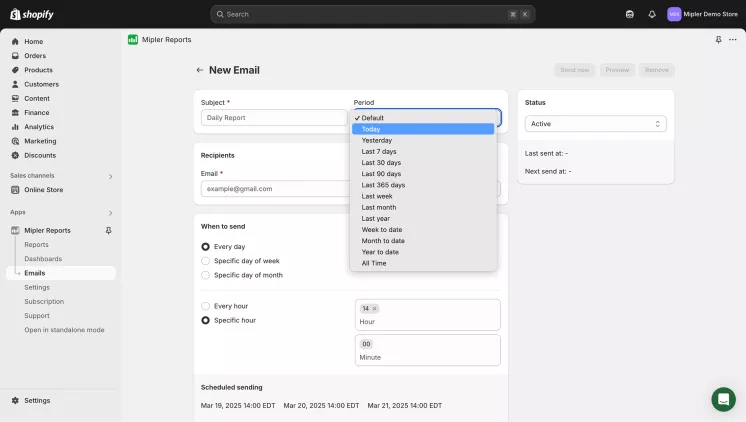
- Save it. Now you'll get your reports every chosen period.


