You are always in control of your store. You can track every step of the way with Shopify Reports. But it's crucial to maintain balance. If you focus solely on the small details, you may miss the big picture. Shopify monthly sales reports allow you to view your store's overall performance.
The report illustrates what you achieved in each month of the year. You can also compare results with the previous year or mark the time period that interests you. In addition to simple monitoring, you can build demand models and track seasonal profit patterns.
Why Is a Monthly Sales Report in Shopify Important?
Besides tracking the number of deals made each month, the Shopify monthly sales report summary might include several other data indicators pertinent for monitoring the store's business performance.
The functionality of the Shopify reporting tool allows you to see the progressions in key sales indicators contrasted with earlier time periods, such as yearly averages.
The monthly sales reports in Shopify, by default, offer data on general sales, displaying such columns as the number of orders, gross sales, total sales, tax, discounts, and returns.
Using filters, the Shopify data can be tailored to better represent your needs. For example, you can see the month with the highest sales within the specified time range or track the month with the lowest sales. Such information can be useful for inventory planning and marketing purposes.
Benefits of a Shopify Monthly Sales Report
A monthly report will give you an advantage if you use it consistently. You don't have to look at the results every day, but it's worth checking your store's performance periodically. If you do, you'll gain numerous advantages over your competitors:
- You'll see a revenue trend.
- You'll be able to assess the impact of marketing on your business. Run a promotion or advertisement for one month and compare it to the previous month's revenue.
- If you see the exact consumption of your products, you can plan their deliveries to the warehouse.
- In addition to inventory planning, you can plan expenses for your other needs.
- You can track seasonal trends and store performance peaks.
How the Shopify Monthly Sales Report Helps You
It is difficult to find the difference between the benefits of the report and what it can help you with. Pay attention to the fact that the Shopify monthly sales report allows you to avoid some problems and can also suggest how to act in certain situations. Data is the basis for decision-making, and the Shopify sales per month report provides this data.
- You can track the progress of the store and compare sales data for different months in one file.
- We have enough data to forecast profit. Accordingly, we can set achievable goals.
- You have enough data to justify changes in pricing policy, approval of marketing budget, and purchase of new inventory.
- Also, the sales monthly report helps you understand how to plan inventory in different seasons. You know the results of previous years and can plan how much inventory to have.
Create Shopify Monthly Sales Reports with Mipler
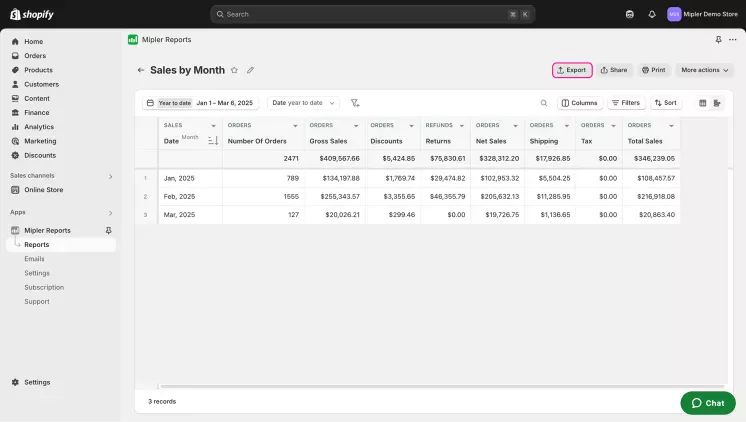
Mipler has developed a Sales by Month Report for easy use. It is included in the basic ones on any subscription plan. Like other Shopify Sales Reports, the main information in the report is displayed in the sales results. You can also see information in the following columns:
- Date Month;
- Number of orders;
- Gross Sales;
- Discounts;
- Returns;
- Net Sales;
- Shipping;
- Tax;
- Total Sales.

Automate Your Shopify Monthly Sales Report to Optimize Your Store
There are several ways to automate your monthly summary report:
- First of all, add custom columns and filters. These steps will help you avoid additional calculations, building additional reports, or searching for data in other reports. You can display additional information in one file.
- Upload the report to Google Sheets. Then all colleagues to whom you send the link will have access to these files. They will be able to make edits and add the necessary data. This will speed up the work of your team with reports.
- Set up an email distribution of the report. Then you will not need to monitor the data every day. You will be able to receive and view it automatically.
Important
By following the monthly summary, you will be able to monitor your profit for each month of the current year in one file. Using this information, you can build a pricing strategy, forecast your budget, and determine the seasonality of demand for your products. You can also compare the results of your store for the current year with the same period last year. This data will give you arguments for making changes in your store.
FAQ
How often should I review my monthly sales reports?
It is best to review the reports at the beginning of each month. You do not need to check the information every day or every week. It is worth monitoring the data as regularly as you deem necessary. Since the data for the previous month is updated in the first days of the next month, forecasting is possible only after you see the whole picture.
What information can I get from a monthly sales report?
The report itself displays the following information about your sales:
- Date Month;
- Number of orders;
- Gross Sales;
- Discounts;
- Returns;
- Net Sales;
- Shipping;
- Tax;
- Total Sales.
If you analyze this data, then you can plan your budget, adjust the purchase of inventory according to future profits. You will also be able to understand the seasons in which the demand for your products increases.
How can I compare sales performance from month to month?
To do this, you need to apply a filter. It helps you customize the display of your report the way you need it. You can specify the dates for which you want the information to be displayed or simply specify a time period to display, for example, 1 year, 2 years, previous year.
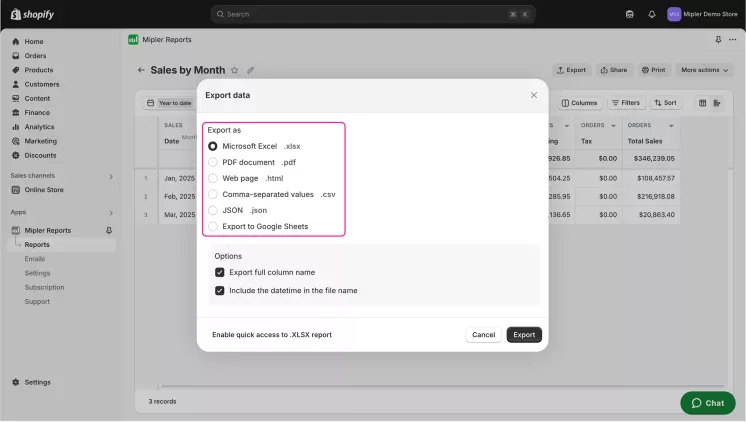
How to download Monthly Sales Report for Mipler?
- Open Sales by Month Report.
- Choose the "Export" button
- Choose file format to download report: