Any Shopify store owner seeking efficient business operations and maximum sales needs the best inventory management. Managing inventory at the correct levels presents a fine operational challenge because large stockpiles consume capital and running out of stock leads to lost opportunities.
The following article demonstrates why inventory planning is the best option for your store, demonstrates its advantages, and presents Mipler as a tool to help businesses remain competitive.
Why the Shopify Inventory Planner is Important
A business without defined processes faces the increased risks of running out of stock and accumulating excessive inventory while making incorrect predictions about consumer needs. A Shopify Inventory Planner provides users with instant product data for better stock management with optimized order restocking, leading to enhanced business operations.

Benefits of the Shopify Inventory Planner
A Shopify Inventory Planner brings multiple aspects to store owners through its application:
- Accurate demand forecasting, which will reduce the risk of stockouts or overstock.
- A proper balance of stock quantities allows you to carry the right number of items.
- Real-time reports from Shopify allow store owners to take better decisions based on data.
- The implementation of automated inventory tracking systems decreases manual work and saves time.
How the Shopify Inventory Planner Helps You
The Shopify Inventory Planner app works as an integrated tool that brings optimization features to store inventory management. Here are various ways how you can use this Planner for your business:
- Analyze Sales Velocity – Establish inventory movement rate for better purchasing decision-making.
- Minimize Stockouts – Prevent inventory shortages from becoming out-of-stock issues to improve your future Shopify Sales Reports.
- Replenish Inventory at the Right Time – Choose the right times for restocking operations to avoid wasting capital through excessive purchasing.
- Identify Dead Stock – Recognize inactive inventory so you can decide through data whether to discount or completely remove these products from your store.
- Manage Overstock Efficiently – Avoid building large inventory quantities because they reduce your capital availability and lead to storage problems.
- Measure Stock Turnover Ratio – Monitor product sales frequency to determine their stock replacement scheduling for optimal operational efficiency.
- Revamp Pricing & Discount Strategies – Adjust pricing of slow-moving products to create sales-oriented discount strategies that increase sales numbers.
Examples of inventory forecasting in Shopify
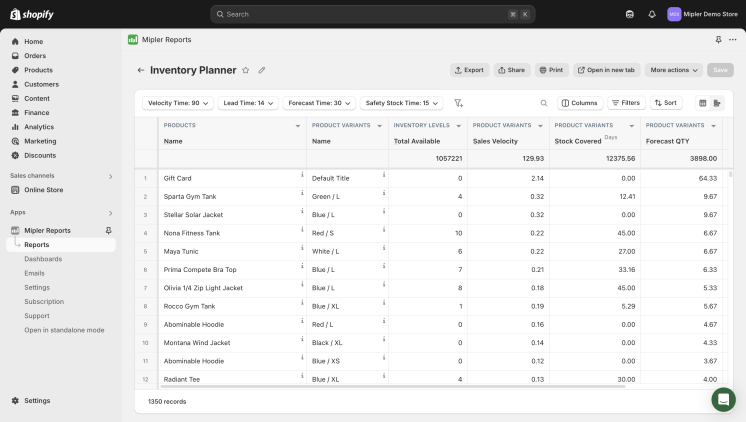
Below we have collected different variations of inventory planner and demand reports that can be used with our app. Additionally, you can adjust built-in inventory planner report or create new reports.
Shopify Inventory Planner Report
It's the default report with simplified calculations and only required columns.
| ProductsName | Product VariantsName | ForecastSales Velocity | Inventory LevelsTotal Available | ForecastForecast QTY 21d | ForecastReplenishment QTY 21d |
|---|---|---|---|---|---|
| Helios Endurance Tank | Blue / L | 0.47 | 0 | 9.80 | 10 |
| Adrienne Trek Jacket | Gray / XS | 12.4 | 78 | 260.4 | 183 |
Shopify Inventory Planner Replenishment Report
| ProductsName | Product VariantsName | ForecastSales Velocity | Inventory LevelsTotal Available | ForecastStock Covered Time | ForecastReplenishment | ForecastReplenishment Time |
|---|---|---|---|---|---|---|
| Helios Endurance Tank | Blue / L | 2 | 8 | 4 days | 30 | 0 days |
| Adrienne Trek Jacket | Gray / XS | 1.5 | 80 | 54 days | 0 | 40 days |
Shopify Inventory Planner Overstock Report
| ProductsName | Product VariantsName | ForecastSales Velocity | Inventory LevelsTotal Available | ForecastStock Covered Time | ForecastOverstock QTY |
|---|---|---|---|---|---|
| Helios Endurance Tank | Blue / L | 2 | 89 | 45 days | 75 |
| Adrienne Trek Jacket | Gray / XS | 18 | 567 | 32 days | 315 |
Shopify Inventory Planner Stockout Report
| ProductsName | Product VariantsName | ForecastSales Velocity | Inventory LevelsTotal Available | ForecastStock Covered Time | ForecastStockout QTY |
|---|---|---|---|---|---|
| Helios Endurance Tank | Blue / L | 2 | 10 | 5 days | 18 |
| Adrienne Trek Jacket | Gray / XS | 18 | 67 | 4 days | 185 |
Shopify Inventory Planner Dead Stock Report
| ProductsName | Product VariantsName | ForecastSales Velocity | Inventory LevelsTotal Available | Product VariantsLifetime Sales | Product VariantsFirst Sold At | Product VariantsLast Sold At |
|---|---|---|---|---|---|---|
| Helios Endurance Tank | Blue / L | 0 | 1420 | 19 | Oct 30, 2018 | Mar 29, 2022 |
| Adrienne Trek Jacket | Gray / XS | 0 | 14 | 5 | Feb 15, 2019 | Sep 19, 2021 |
Automate Shopify Inventory Forecasting Report with Mipler to Optimize Your Store
Shopify Inventory Reports from Mipler provide automated inventory forecasting capabilities to users. Mipler helps Shopify store owners gain the following features:
- The system easily creates comprehensive inventory forecasting reports.
- Stock alerts and reorder points can be customized by users within the system.
- Our supply chain obtains higher operational efficiency by using analytics features based on real-time data.

Key terms and calculations
-
Sales Velocity - the number of sold items for the period (usually means velocity per day)
Simplified formula to calculate velocity based on the past 30 days:
Sales Velocity = Sold Quantity ÷ 30
-
Lead Time - how many days you need to receive a product to your stock (that time includes all steps: placing an order to the supplier, signing, delivery, etc.)
-
Lead Time Quantity - how many items will be sold within the Lead Time period.
Lead Time QTY = Lead Time × Sales Velocity
-
Service Level - the expected probability of not hitting a stock-out during the next replenishment cycle (or the probability of not losing sales).
Usually, the Service Level is in the range of 70-90%.
-
Safety Stock - the extra quantity of inventory (buffer or reserve) to prevent out of stock if some problems occur.
Safety Stock = Sales Velocity × Lead Time × Service Level
-
Reorder Point (ROP) - the stock quantity that triggers replenishment.
Reorder Point = Safety Stock + Lead Time QTY
- Stock QTY - the actual stock quantity.
-
Stock Covered Time - how many days the current stock will cover sales.
Stock Covered Time = Stock QTY ÷ Sales Velocity
-
Stockout QTY - if the value is positive, it is a deficit, since the product can be delivered from the supplier in time, even if the order is placed right now.
Stockout QTY = Lead Time QTY - Stock QTY
-
Replenishment Quantity - how many items need to be ordered to prevent out-of-stock situations.
Replenishment QTY = Reorder Point QTY - Stock QTY
-
Replenishment Time - when (how many days) products should be reordered.
Replenishment Time = Stock Covered Time - Lead Time
Important
Choose an inventory planner Shopify app because such a tool offers customizable reports with seamless integration with automation features. Mipler proves it due to its detailed reporting framework which specifically suits Shopify retail business managers.
FAQ
What is an inventory planner Shopify app?
The inventory planner app in Shopify functions as a platform which assists business owners to track their inventory quantity and predict market demand patterns while making stock purchase decisions with data-driven insights.
How does inventory forecasting work in Shopify?
Businesses that use inventory forecasting tools review previous sales metrics and buyer patterns to determine projected customer needs during the upcoming period. This allows them to achieve excellent stock inventory levels.
Why should I use Mipler’s Shopify Inventory Planner?
Mipler provides flexible inventory reports with real-time stock observation and automatic predictions, which make inventory handling both smooth and effective.
Can I automate my Shopify inventory forecasting?
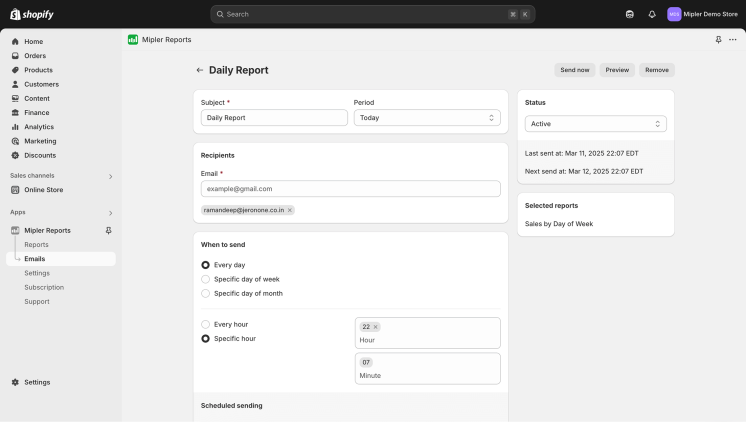
With Mipler Shopify Reports, you can schedule automated email reports to receive inventory insights directly in your inbox at a chosen time. This ensures you stay updated on stock levels without manual effort.
