It is difficult to imagine a situation when products move uncontrollably between sellers and buyers. Shopify Reports play the role of a controller that reports to the owner how many products were sold, how many were returned, and how much profit the store made.
We will tell you how you can find out the preferences of buyers and plan marketing campaigns from the information provided.
When working with detailed analytics, many store owners also generate a Shopify product order report to compare sales dynamics between different periods. This type of reporting is especially helpful for identifying seasonal trends and understanding which products drive the highest revenue.
What is the Sales by Product Report in Shopify?
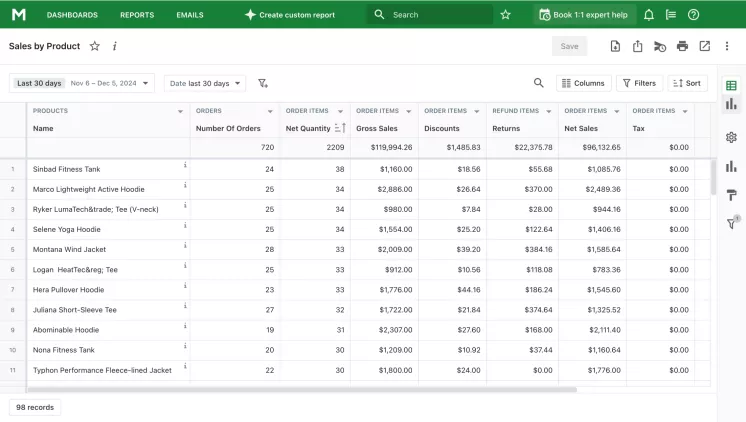
Sales by Product Report Shopify is a tool that will become your desktop book. It is used by store managers and salespeople to analyze sales. You will see the following information in the report:
| Column Name | Description |
|---|---|
| Number of orders | Total number of orders made by customers. |
| Net quantity of product in all orders | Quantity of products sold after adjustments. |
| Gross sales | Total sales before any deductions. |
| Discount | Amount discounted on sales. |
| Returns | Quantity of products returned by customers. |
| Net sales | Gross sales minus discounts and returns. |
| Taxes | Total tax collected on sales. |
| Shipping cost | Cost of shipping products. |
| Total sales | Final amount after all adjustments. |
How does it work? Everything is simple! You specify the date range you are interested in and the report shows all of the above information for all of your products. All product options are considered. If you sell t-shirts in different colors, they will all be counted in one ribbon. If you want details, then you need to use the Sales by Product Variant or Sales by Product SKU report.
If you need to analyze sales performance more deeply, you can import Shopify orders and products into your reporting tool. This way, you'll have a unified dataset to work with, allowing you to segment results by customer, product type, or even shipping region.

What information does the Sales by Product report show
The Sales by Product report (also called Product Performance) is a common report used by store managers and salesmen for sales analysis. This report opens a view on specific product sales.
For managers who prefer direct product-to-order tracking, generating a Shopify products order summary helps in understanding the exact connection between each item and its corresponding order.
The report is presented by the manually selected date range. Typically, it is formed as a table with each row corresponding to one product. The columns of the report are used to display various sales statistics on this product.
Depending on the reporting app the store uses, it can be possible to transform the report output form from a data table to a graphic chart.
How the Shopify Sales by Product Report Helps You
What else can the Shopify products sold report be useful for? Here are some promised insights:
- Preferences of your customers. Sort products by number of products sold. At the top of the list, you will see favorites.
- Optimization of stocks. Those goods that buy the best should spend more space in the warehouse. Now you know what products you need to buy, and you can optimize your purchasing strategy.
- Marketing campaign planning. Stimulate demand for unpopular items to sell leftovers, and for popular items to increase your profits.
- Work on errors. Sort products by the number of units returned. The first on the list will be those that for some reason did not suit the buyer. You can check the quality of the product itself or the cost of its delivery and eliminate defects.
Many businesses also keep a Shopify order products breakdown for inventory purposes. By using a Shopify product order dashboard or exporting product order Shopify data, you can monitor both sales volume and refund rates in one place.
What questions can the Sales by Product report answer
The Sales by Product report allows tracking all information generated by product sales. It can be used to answer questions such as:
- Get total sales amounts of all products in a store for any time period.
- See how well a specific product is selling.
- Get the best and worst selling products in your store.
- Compare specific product sales with the previous time period.
- For each product, get the number of ordered and refunded items.
- For each product, track coupons and discounts.
The list of answers you can get with the Sales by Product report can be extended by using additional data columns and data filters.
Similar reports to the Sales by Product report
Sales statistics in a store are not limited exclusively to data on product sales. A Shopify store owner may use several other sales reports alongside the product sales report.
Often in conjunction with product sales reports, store managers use such reports as sales:
| Report Type | Description |
|---|---|
| By product vendor | Sales grouped and analyzed by the product's vendor. |
| By product variant | Sales broken down by individual product variants (e.g., size, color). |
| By discount | Sales segmented based on applied discounts. |
| By traffic referrer | Sales analyzed by the source of traffic (e.g., Google, social media). |
| By billing location | Sales categorized based on the customer's billing address. |
| By checkout currency | Sales grouped by the currency used during checkout. |
| By channel | Sales distributed by the sales channel (e.g., online store, POS). |
| By customer name | Sales records organized by customer names. |
Advanced users sometimes run custom queries such as Shopify for product in order to automate repetitive reporting tasks. This is particularly effective for large catalogues where manual tracking is time-consuming.
Additionally, the store manager can build sales reports by product tag, POS location, and a dozen other similar reports on sales. The exact list of available reports depends on the utilized reporting app.
Key columns of the Sales by Product report
The default configuration of the Sales by Product report in Mipler includes such columns as:
| Column Name | Description |
|---|---|
| Product Name | The name of the product listed in the report. |
| Number of Orders | Total number of orders that include the product. |
| Order Items Total Quantity | Total quantity of the product ordered by customers. |
| Refund Items Total Quantity | Total quantity of the product refunded by customers. |
| Refund Items Total Amount | Total monetary amount refunded for the product. |
| Order Items Total Net Amount | Net amount after refunds and discounts are applied to the product. |
| Order Items Total Discount Allocation | Total discount applied to the product across all orders. |
| Order Items Total Price | Total price of the product calculated as price multiplied by quantity. |
You are totally free to exclude any existing columns from the report or add several additional ones. Simply choose available columns from the list.
Here is how some of the key columns in the default report are calculated:
- Order Items Total Quantity is calculated as the total quantity of products sold after returns are deducted.
- Refund Items Total Amount is the amount of money that has to be refunded for the total quantity of specific products requested for a refund by the customer.
- Order Items Total Net Amount is the monetary sum that is calculated as the difference between the sum of the total orders for a product and the refunded amount.
- Order Items Total Price is calculated per product as its price multiplied by the ordered quantity.
Here is how some additional key columns are calculated that you may use:
- Shipping orders are obtained per product as the difference between its total shipping price and order adjustments total shipping amount.
- Inventory Planner Replenishment QTY / 21 days. This optional data column is calculated as the product quantity multiplied by 21 minus the available quantity in stock.
Variations of the Sales by Product report and the questions they answer
Using filters and sorting options, you can get answers to a number of specific questions regarding sales. Here are some examples of the report variations.
How to see product sales by country
You can easily know what products you sell in a certain geographical region. Simply use the location filter when generating a sales by product report.
Navigate to Locations filter to filter out sales by city or province. Use the filter in the Sales section to filter out data by country.
You can also get a live view of your sales geography by utilizing a Live View analytics option default Shopify provides. It shows orders and visitors on a global 3D map in almost real time.
How to see products low in stock
The Sales by product report can display the information on available stock. Simply add the Inventory Planner Qty data column.
Sort the data table by the inventory quantity to see the products with the lowest stock number. In this way, you can quickly track items that may soon need to be replenished. Filter by stock quantity and get the products that fall within a specific range.
How to make ABC analysis
The so-called ABC report gives you a different perspective on the inventory by dividing all products into three grades:
- A-product - generates 80% of revenue
- B-product - generates 15% of revenue
- C-product - generates 5% of revenue
From a financial standpoint, it makes more sense to concentrate on A-products to get the most profits. Filter by the Total Gross Profit data column to see what products fall into the A, B, C range for your store.
Extending the Sales by Product report
The Sales by Product report can be extended with data columns default to other reports. Here are some typical uses.
Cost of Goods Sold (COGS)
The term "Cost of goods sold (COGS)" stands for the direct cost of making sales. It includes expenses required for making the sale, for example, personnel salary. Use the Orders COGS to get this data column.
Track inventory level
Mipler offers a specific Shopify Inventory Planner report to display the data on the product stock in your shop. You can add its data columns to the Sales by Product report.
Inventory Planner includes such columns as:
| Column Name | Description |
|---|---|
| Sales Velocity / last 30 days | The average daily sales rate of a product over the past 30 days. |
| Total Available | The current stock level, including inventory on hand and in transit. |
| Forecast QTY / 21 days | Predicted quantity of the product needed over the next 21 days based on sales trends. |
| Replenishment QTY / 21 days | Quantity of the product that needs to be restocked to meet the forecasted demand for the next 21 days. |
Use these columns to track currently available stock quantity, get the sales speed for each product, forecasted quantity left in stock, and the number of products to be replenished in 21 days from the date the report was generated.
First and last purchase date
The data in the Variant Facts table of your store database keeps track of the dates when the specific product variant was first and last ordered.
Shopify Product Management: Key to Efficient Sales Analysis
The main purpose of Shopify product management is to track sales activities to optimize business performance metrics. This reporting system generates data that presents order placing information, return, and revenue statistics. Employees can get a deeper understanding of product stock patterns and customer purchasing trends through the Sales by Product reports.
Create Shopify Sales by Product Report with Mipler
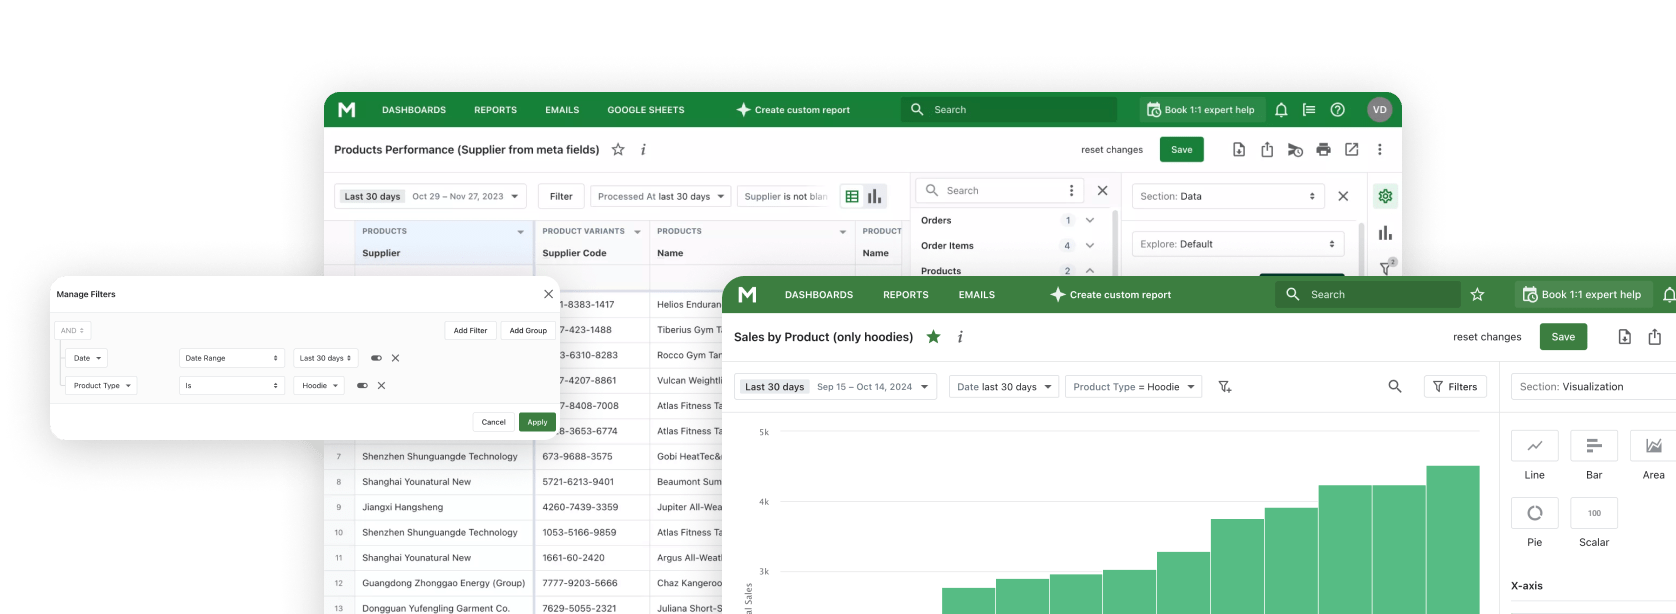
In addition to the classic sales report, you can create reports that will relate to some special products. For example, sales of goods from different manufacturers. You can create a separate report for each, or you can group goods by manufacturer in one report and see how demand changes depending on quality and price.
You can make changes to existing Mipler product sales reports. Add the necessary filter or column to display the information you need. You can also contact the support service to create the product sales report that will suit your needs.
Important
Sales analytics are key to the success of an online store. Using tools like Mipler, you can not only
generate reports, but also integrate them into your business strategy.
Learn more about Shopify Sales
Report and take your business to the next level!
FAQ
What is Shopify Sales by Product Report?
The Sales by Product report (also called Product Performance) is a common report used by store managers and salespeople to estimate how much each product sold during a given period.
Why is Shopify Sales by Product Report important?
Sales are the success of the store. The sales report helps you analyze each product and see how the sales of each of them affect the overall picture.
Are there other Sales by Product Reports?
Mipler also offers other product sales reports:
- Sales by Product Variant
- Sales by Product SKU
- Sales by Product Type
- Product performance by Supplier
How does Shopify product management help track product performance?
Shopify product management lets owners monitor their product performance metrics. All order information of net sales, returns and discount information can be found in this report. Data from this system shows which products have the highest sales volume which allows owners to improve stock selection and marketing plans.
How to get a Shopify sales report by product tag from Mipler app?
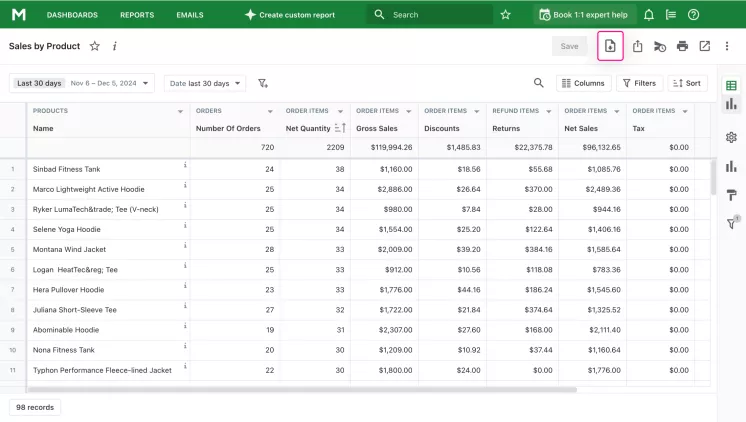
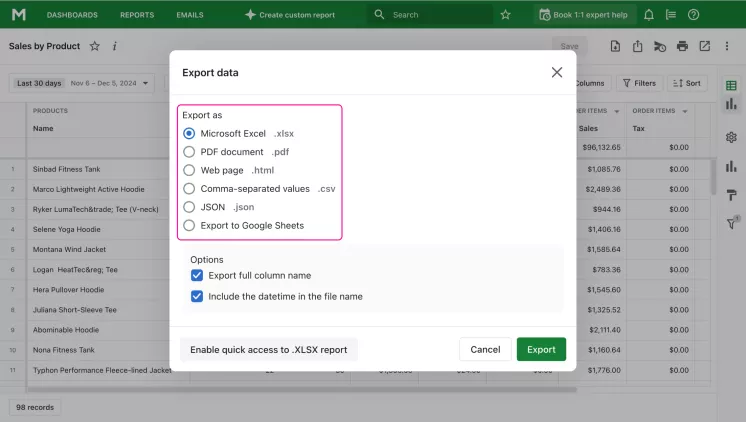
Open "Sales by Product" report. Click the "Export" button.

Choose the format in which you want to download and click "Export".

