What is the Shopify Sales by Collection Report
You clearly use collections so that customers can easily find the product on the site. And Mipler offers a collection sales report for Shopify stores so that you can easily evaluate sales by each category. The Shopify Sales by Collection report is a document that gives store owners insight into the performance of their product collections.
The difference from other Shopify Reports is that the sales data is grouped by the collections that are on your site. This report helps sellers determine which collections generate the most revenue, attract the most customers and drive repeat purchases.
Why Sales by Collection report is important
The summary of product collections in the store shows the breakdown of sales and revenue for items that belong to specific groups – collections.
It is another way to look at sales in a store besides direct
Shopify Sales by Product
or
Shopify Sales by Variant reports.
Shopify out of the box does not provide a summary report by collections. However, it can be generated with the help of a third-party reporting app, like Mipler Advanced Reports, which provides more than 60 different reports. The default configuration of this report brings data on general sales of products grouped by collection.
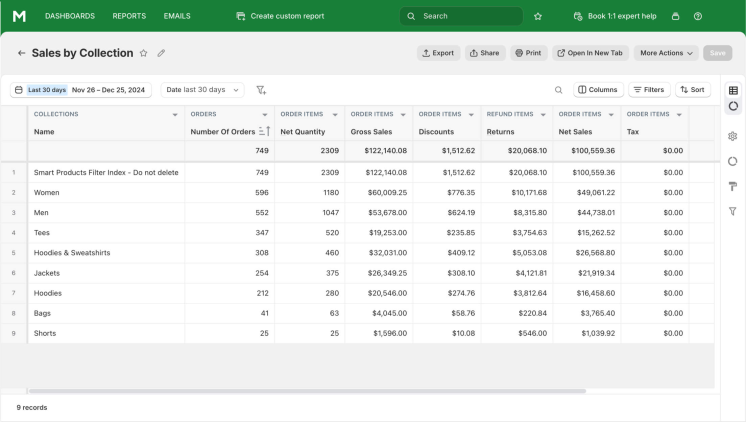
The reports usually include columns such as the number of orders, net quantity, gross sales, discounts, refunds, taxes, and net sales.
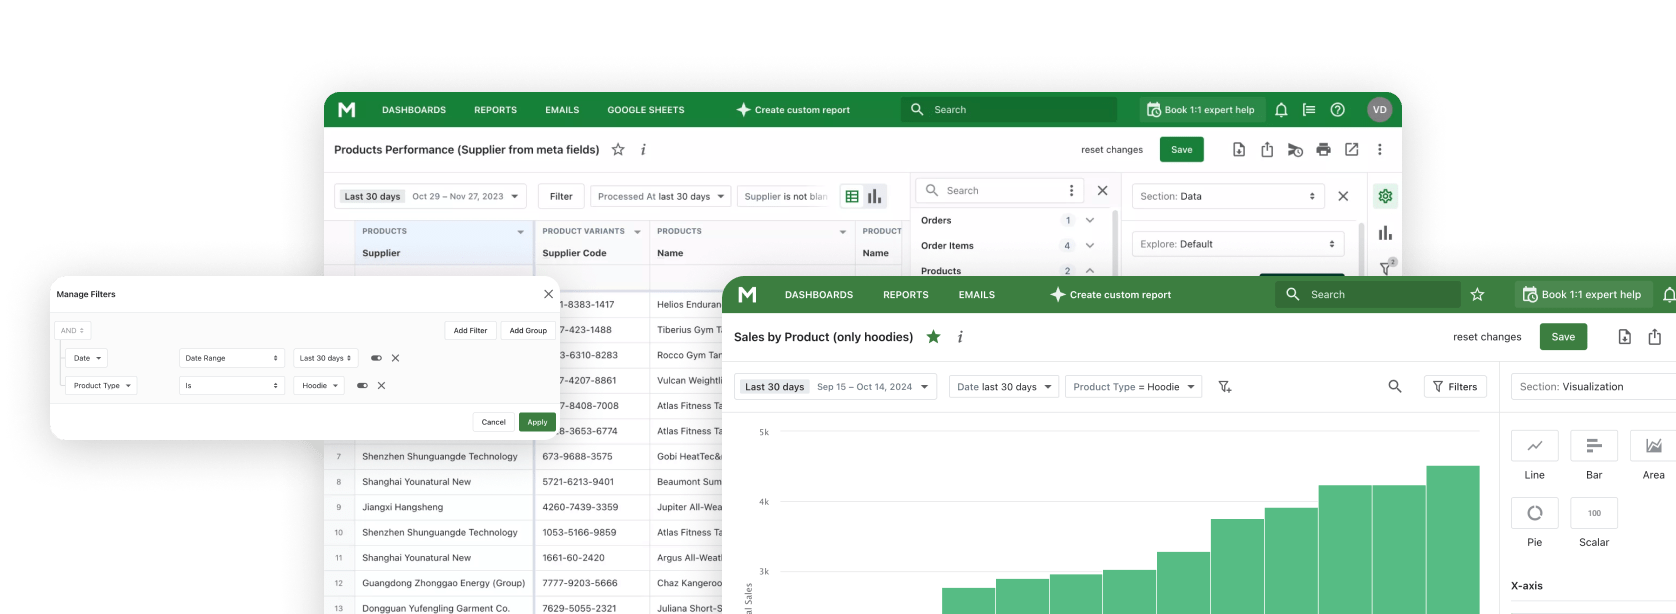
Live example of Shopify Sales by Collection ReportFilters can be used to make the data more representative of the store manager's needs. For example, you can see product collections by their name or sort them by the number of orders. Such information can be useful for inventory planning and marketing purposes.
How the Shopify Sales by Collection Report Boosts Your Profitability
The task of all Shopify Sales Reports is not only to show information, but to help find the answer to the question "How to increase profitability?". Here are some tips:
- Focus on high performing collections. Allocate resources so that profitable product collections are promoted through advertising and discounts.
- Identify ineffective collections. Shopify sales report by collection will help identify groups of products with reduced sales. Review product prices, quality, shipping costs, and adjust your marketing efforts to improve their performance.
- Improvement of inventory management. The Collection report in Shopify will show which products should be in stock and which should not be purchased in excess. By understanding what exactly will be sold, you can effectively use the space in the warehouse and reduce the amount of dead inventory.
- Improve your marketing campaigns. If you can't sell items from an unpopular collection, use marketing. Offer customers to purchase an unpopular item at a reduced price along with a specific popular item. Attract customers with unique offers and combinations of products.
What questions report Sales by Collection can answer
Start from this report if you need to split up the sales in your store through collections.
The data displayed in that report can be used to answer questions such as:
- What number of orders each product collection generated for the specified period of time.
- What are the top-selling and worst-selling product categories in your store.
- What are the key sales indicators (gross, net sales) for each product collection
- Which collections had the highest and lowest average order values?
- Products from what collections are most often requested for refund, i.e. return rate per collection.
- Products from what collections are purchased with the highest number of discounts
- What product categories have the highest sales for customers of a specific region.
- What is the customer lifetime value (CLV) for each product collection.
Note that you can easily expand the list of answers by using additional data columns or filters.
Default Sales by Collection Report
| CollectionsName | OrdersNumber of orders | Order ItemsNet Quantity | Order ItemsDiscounts | Refund ItemsReturns | Order ItemsNet Sales | Order ItemsShipping | Order ItemsTotal Sales |
|---|---|---|---|---|---|---|---|
| Tops | 57 | 57 | $646.56 | $781.95 | $7,203.34 | $905.25 | $8,108.59 |
| Outwear | 47 | 69 | $980.30 | $338.00 | $8,399.70 | $883.80 | $9,283.50 |
| New | 45 | 51 | $589.79 | $1,279.00 | $5,037.21 | $733.65 | $5,770.86 |
| Suits | 40 | 41 | $605.31 | $726.00 | $5,788.69 | $676.14 | $6,464.83 |
| Bottoms | 38 | 40 | $435.14 | $643.00 | $3,358.86 | $446.41 | $3,805.27 |
| Dresses | 21 | 25 | $65.10 | $0.00 | $2,802.90 | $406.08 | $3,208.98 |
| Sets | 21 | 17 | $51.90 | $880.00 | $1,286.10 | $332.00 | $1,618.10 |
| Shoes | 20 | 20 | $70.65 | $188.00 | $2,062.30 | $328.54 | $2,390.84 |
| Wear | 15 | 17 | $350.25 | $318.00 | $1,422.75 | $185.10 | $1,607.85 |
| Bags | 6 | 7 | $13.35 | $0.00 | $609.65 | $137.23 | $746.88 |
| Jump Suite | 3 | 1 | $0.00 | $338.00 | $69.00 | $39.64 | $108.64 |
| Hats | 2 | 2 | $0.00 | $0.00 | $215.00 | $11.90 | $226.90 |
| Leather | 0 | -1 | $0.00 | $209.00 | $-209.00 | $0.00 | $-209.00 |
| 108 | 156 | $1,512.65 | $2,358.95 | $16,192.25 | $2,233.60 | $18,425.85 |
Key sales indicators in a report
Split the sales data by categories using Mipler and be informed on key sales metrics. Expand this summary with additional columns to get a detailed view.
For example, you can see the available inventory per each collection, see sales velocity per collection to avoid the out-of-stock situation. Additionally, get info on the date of the last order in each collection.
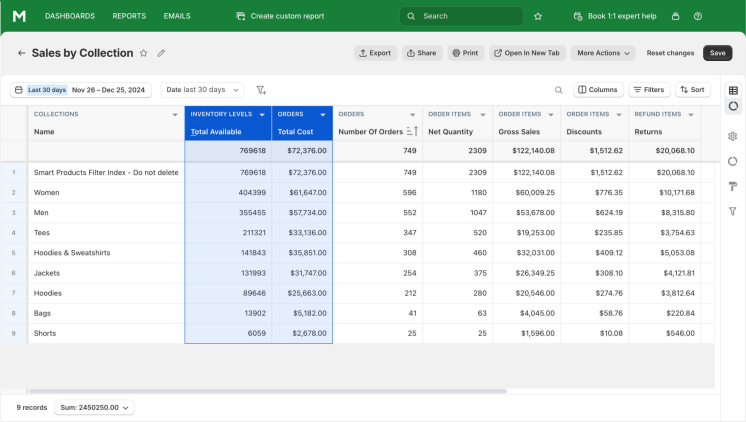
Track the number of orders, gross and net sales, total quantity within the specified time range. For each product category, this summary output displays such data as:
- Number of orders
- Taxes
- Discounts
- Refunds
- Gross Sales
- Net sales
Use these columns to glance at the current financial and fulfillment statuses for each order within the selected dates and compare with other periods.
Reports similar to Sales by Collection
The store data on sales can be tracked from multiple scopes to offer the best data representation.
When the store manager generates this report, the app does not limit them to modify the summary by the date. The store manager can obtain the summary based on other data factors pulled from the store database.
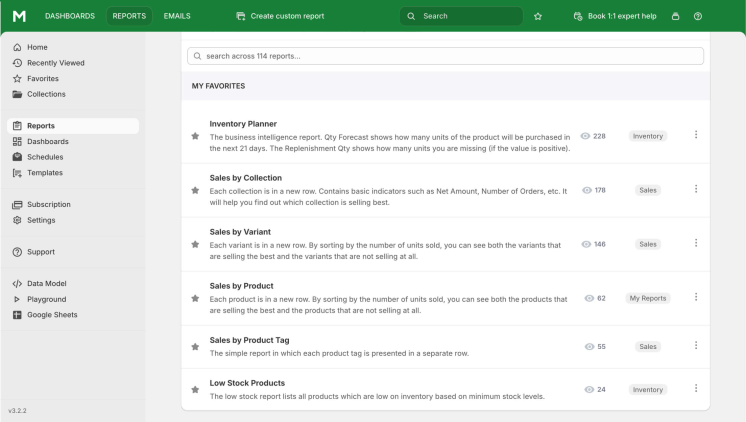
In conjunction with the variant sales, a store manager can often use such summaries as:
- Sales by product. Displays the information on purchases for each product name or SKU.
- Sales by Product Type. Contains basic indicators such as Net Amount, Number of Orders, etc. It will help you find out what type of product sells best.
- Sales by Vendor. Contains basic indicators on sales such as Net Amount, Number of Orders, etc. Use this summary to find out the brand that has the best sales.
- Sales by Vendor > Product > Variant. Similar to the Sales by Vendor report, but more detailed. The report is sorted by vendor, product, and variant.
Key columns for sales by collection
Typically, the table with the data on the collection’s sales consists of such columns as:
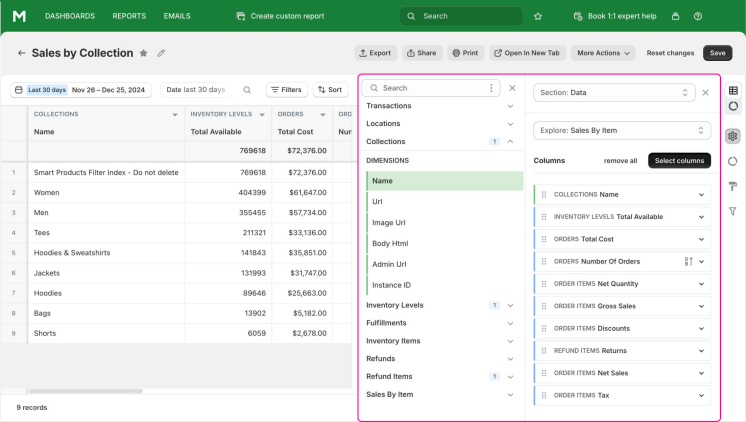
A store manager has full control over the summary being generated. They are totally free to exclude any of the existing columns or add more. Simply choose the available columns from the list.
Here is how some of the key columns in the default report are calculated:
-
Order Items Net Quantity - this column is calculated through the total quantities of ordered and refunded items.
[Order Items Net Quantity] = [Order Items Total Quantity] - [Refund Items Total Quantity]
-
Order Items Gross Sales - the final column of the default report is calculated through the variant’s price and quantity.
[Order Items Gross Sales] = [Product Variants Price] × [Order Items Quantity]
In case the tax is included, the Gross Sales formula will look like the following:
[Order Items Gross Sales] = [Product Variants Price] × [Order Items Quantity] – [Order Items Tax Amount]
-
Order Items Shipping - displays the shipping cost that is calculated as:
[Order Items Shipping] = [Order Items Shipping Price] ÷ [Order Facts Quantity] – [Order Items Quantity]
-
Order Items Total Sales - the total sales data per product collection is calculated as:
[Order Items Shipping] = [Order Items Net Sales] + [Order Items Tax] + [Order Items Shipping Price]
Variations of Sales by Collection report
A store manager can get another view on sales besides grouping sales by product collections. Using variations of the default report, they can obtain a clearer insight into the business performance of the online store.
One of the easiest ways to glance at business success is to compare a specific date range to a previous period. Using filters and sorting options, you can get answers to some other questions regarding sales. Here are some examples of the report variations.
How to see sales by location
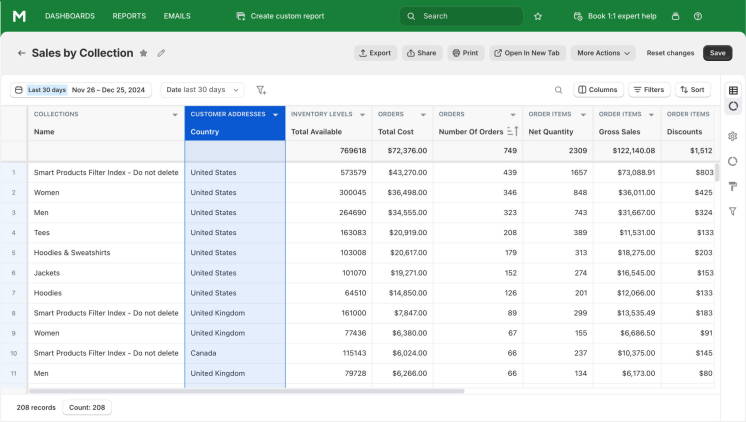
Easily see the sales data for each product collection with the data on customers' geographical distribution. See what provinces, cities, and countries you have the most or least purchases for each product category.
How to see customer lifetime value
It is well known that existing customers cost less than attracting new ones for a store. Depending on the purchases each customer makes, they set their own individual value for a store. You can easily see the customer lifetime value with the CUSTOMERS CLV data column. Use it to monitor for signs of shoppers' attrition in your store.
How to see gross margin in percent
Gross margin is one of the parameters for the business performance, which shows how much financial funds the store retains. The higher this indicator is, the more capital is available to pay for other costs.
See the gross margin in percent by activating a corresponding column.
[ORDERS Gross Margin, %] = ([ORDERS Net Sales] - [ORDERS COGS]) ÷ [ORDERS Net Sales] × 100
The result is rounded to two numbers after the comma sign. If the calculation result is negative, the report shows zero value in a table.
How to get details on sales transactions
The sales overview can be extended with the data columns on transactions. You can get such information as:
- Gateway the operation was made from
- Source name of the transaction
- Current status of the transaction
- The type of the transaction (sales, refund)
- Creation timestamp
- Transaction total amount for each sale day
How to see the total cost of ordered items
The total cost of ordered items in the order is calculated as:
[ORDER ITEMS Total Cost] = [ORDER ITEMS Quantity] × [INVENTORY ITEMS Cost]
How to see the type of customer
A store can have both new and recurring customers, the latter being preferable. Merchants can easily see what types of customers buy in their stores within the ORDERS Customer Type column.
In case the date of the customer’s first order is equal to the order processing date, then the customer is considered a first-time buyer. Otherwise, they are assigned to a Returning type. If the report cannot detect the customer ID, it will display the Unknown value.
How to get total sales for orders
Get the sum of total sales calculated as:
[ORDERS Total Sales] = [ORDERS Net Sales] + [ORDERS Shipping] + [ORDERS Tax]
The ORDERS Net Sales is obtained as:
[ORDERS Net Sales] = [ORDERS Gross Amount] - [ORDERS Discounts] - [REFUNDS Returns]
The ORDERS Shipping is obtained as:
[ORDERS Shipping] = [ORDERS Shipping amount] - [ORDER ADJUSTMENTS Total Shipping Amount]
The ORDERS Tax is obtained as:
[ORDERS Tax] = [ORDERS Taxes] – [REFUND ITEMS Total Tax Amount]
Create Collection Sales Reports in Shopify with Mipler
Mipler provides a ready-to-use Sales by Collection Report, eliminating the need to create it from scratch. However, you can enhance the report by adding details that you find valuable:
- Add Extra Columns: For instance, include the order name to see which specific orders contributed to sales in each collection.
- Apply New Filters: Filters help you refine the report’s data. By default, the report shows monthly data, displaying total sales for each collection within the month. Adjust the time range to a year and sort the data by total sales to identify your top-performing collections.
- Export to Google Sheets: Export the report to Google Sheets for additional data input, advanced calculations, or in-depth analysis.
If you’re unable to make the necessary updates yourself, our support team is ready to assist!
FAQ
What is the Shopify Sales by Collection Report?
It is a report that groups sales data by product collections, helping you analyze and compare the performance of different collections in your store.
What key metrics are included in the Sales by Collection report?
Shopify reports collection sales results in such metrics as:
- Order quantity
- Net quantity
- Gross sales
- Discounts
- Refunds
- Taxes
- Net sales
How can this report help store management?
By analyzing sales data for each collection, you can identify the best-selling and worst-selling product categories, helping you to effectively plan your inventory and create marketing strategies.
How to get a Shopify Sales by Collection Report from Mipler app?
- Open Sales by Collection Report
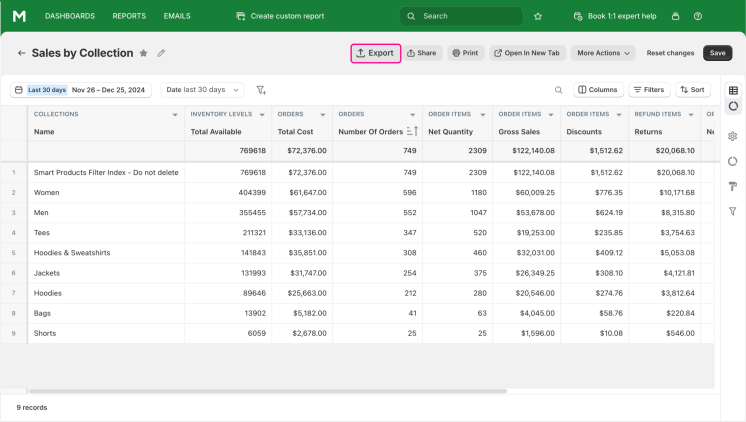
- Choose “Export” button:
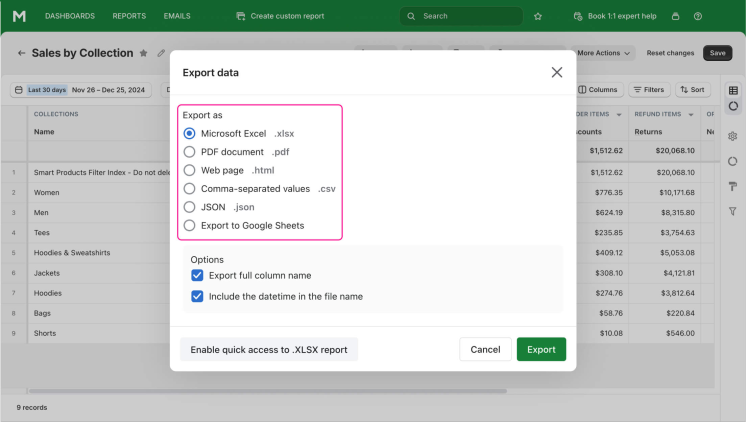
- Choose file format to download report:
