Manage Columns
Click the Edit Columns button or Gear icon from the report window to enter the Manage Columns menu.

The following sections will be available there:
✅ Data
✅ Visualization
✅ Table Options
✅ Toolbar
Data
The default tab, where you can add, sort, and remove columns.
Additional options can be found here:
✅ Select a Model: Choose between sources.
✅ Select an Explore: Entity to be used as a general.
✅ Add Column: Add columns from the list.
✅ Remove All: Remove All Columns from the report with a single click.
✅ Sort Columns: Use the Drag'n'Drop action to sort the columns.
Visualization
Switches the table presentation from the table type to the chart.
The following chart types are available:
✅ Line Chart
✅ Bar Chart
✅ Area Chart
✅ Column Chart
✅ Pie Chart
✅ Scalar (single value)
Table Options
Setting up column title.
Toolbar
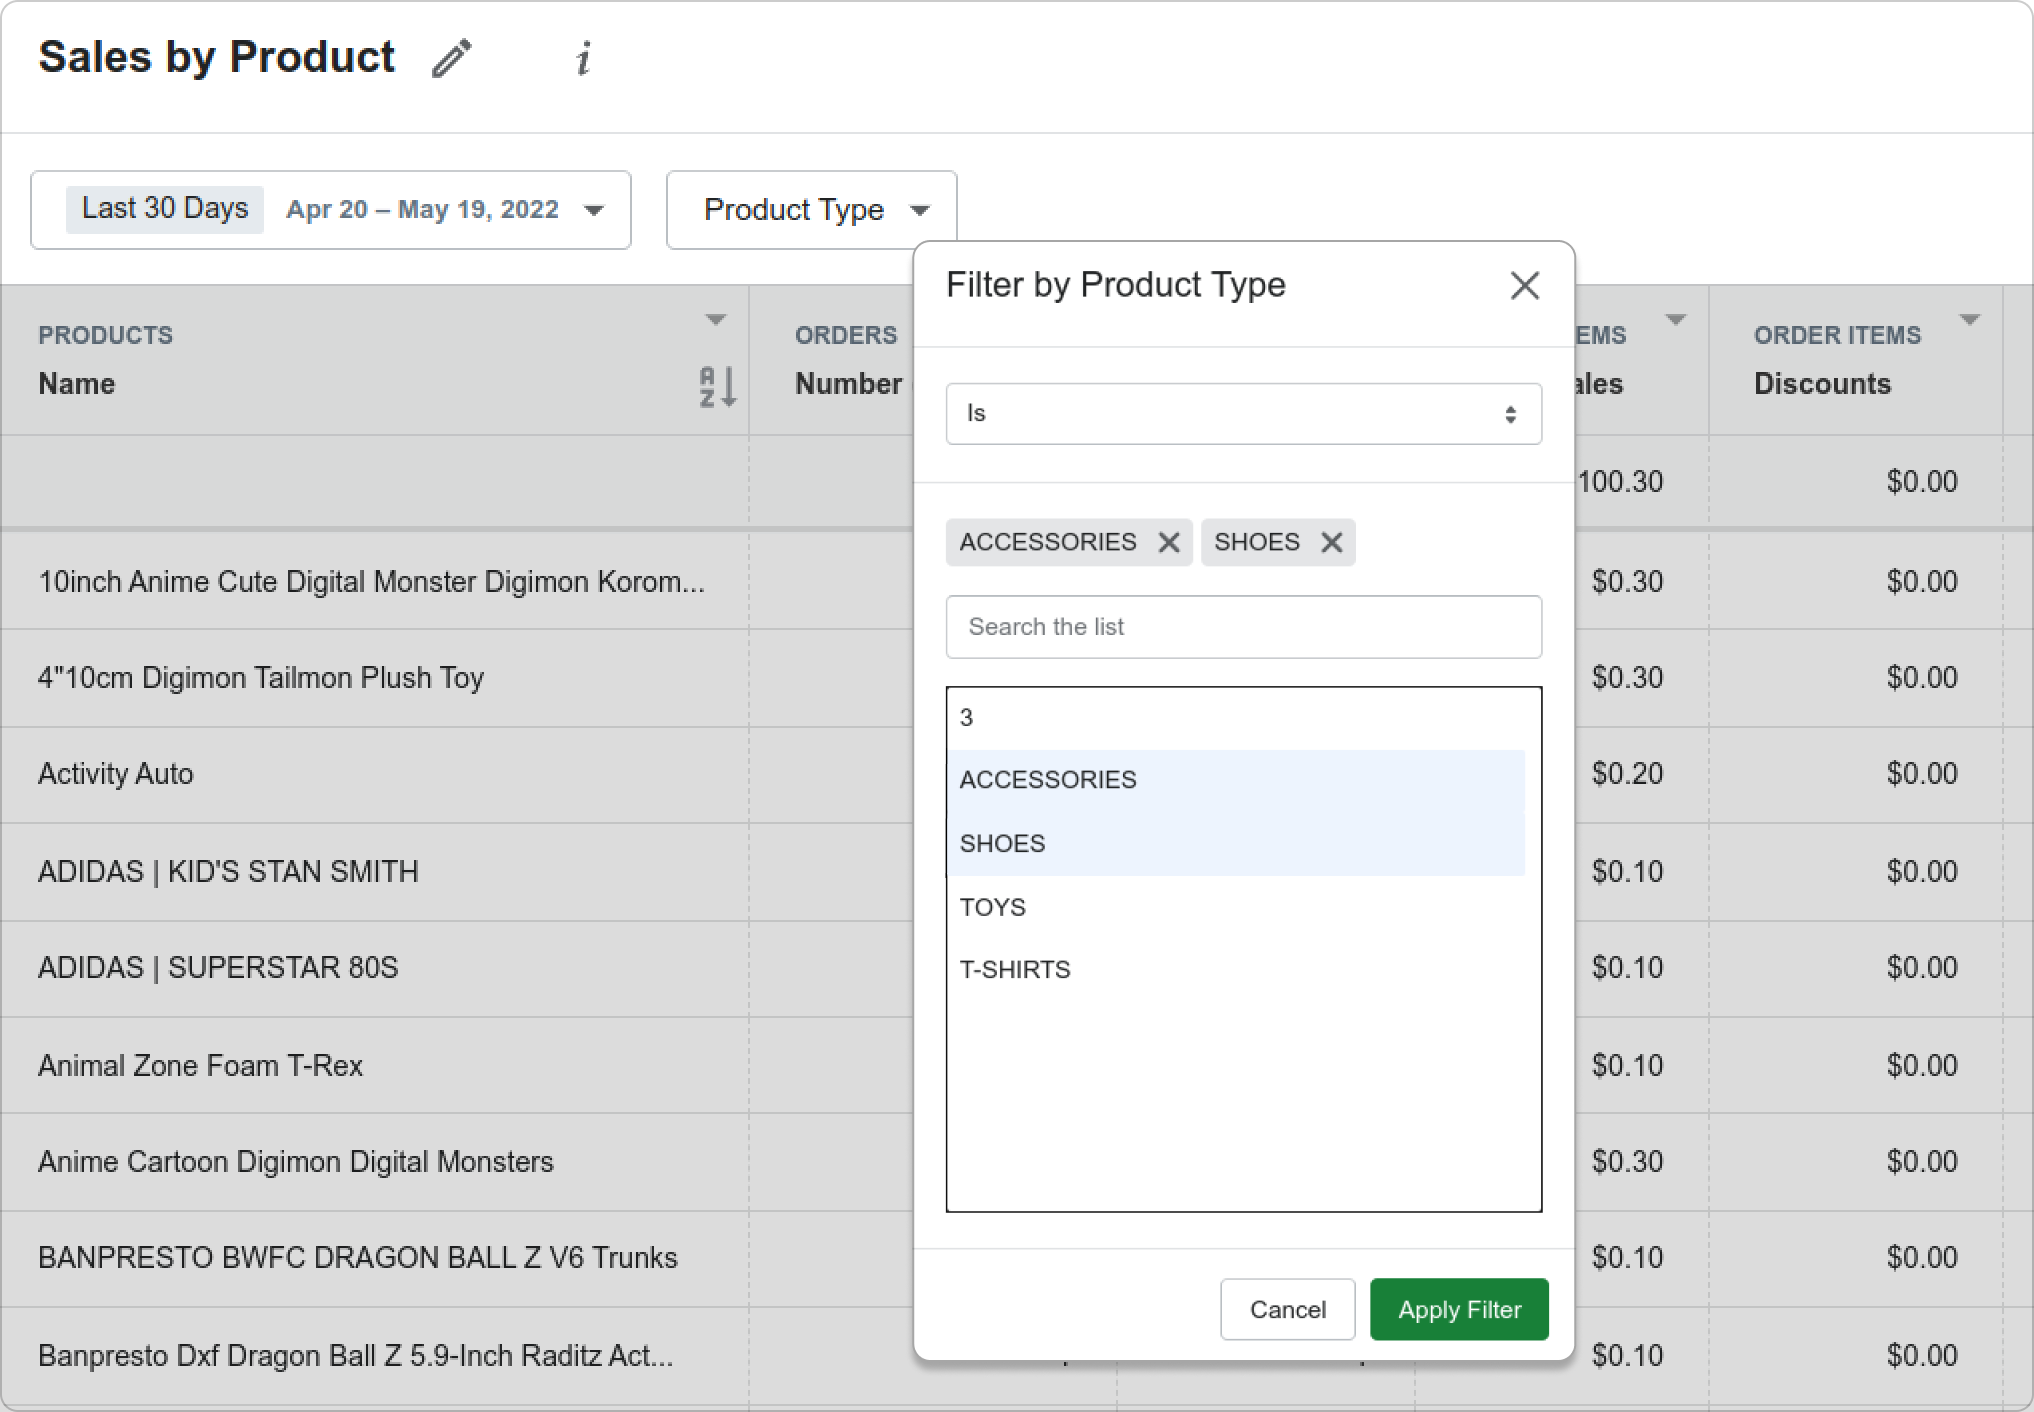
Manage fast filters on the toolbar here.
Here you can add columns that were used as filters.
Details
Example
If you want to have a quick switch between the product types.Just add Product Type column in the toolbar, so you can enable fast filter by product type from the toolbar:
How to add columns
- Click the Manage Columns button
- Click on Add Column
- Use Search Bar to find the desired column
- Click on the column
- Close the Edit Columns menu
- Close the Manage Columns menu
- Click the Save button to save the changes permanently