
When dealing with Shopify inventory management on your own, reports are the best help you can get. Effective planning and tracking, especially for larger shops, is no work for pen and paper. Today, we offer you a comprehensive article on inventory reports. You may learn what they are, why they are important, what types there are, and how to utilize them. Let’s dive right in.
What are inventory reports?
Inventory reports provide information and analysis of your stock and things connected to it. For instance, how many wares do you have, where are they located, what’s the demand for certain items, when do you need to restock, etc. All this data is served in the form of coherent charts and tables.
The main purpose of these reports is to help you manage your inventory. And it means more than just accounting for present items. Inventory reports also allow you to forecast demand, plan restocking, identify dead-weight items, and adjust logistics. Storing, moving, selling, buying – anything you do with your stock can be put into an inventory report.
Why do inventory reports matter?
Small-scale Shopify stores might never think that they need to use inventory reports. One supplier, few operations a day – what is there to track? However, even small shops benefit from good inventory planning. For example, using forecasting reports, you can minimize storage payments by ordering just enough items in precise timing to avoid overstock. On the other hand, analyze the demand peaks from the past years and plan a larger order near those dates.
For large-scale shops, inventory planning and management are crucial. Even tracking available stock can be difficult if you have thousands of SKUs and hundreds of orders weekly. Not to mention dead-weight items lurking at the bottom of the warehouse and the constant need to resupply. Without proper reporting and analysis, managing large stock is a nightmarish task. So, how exactly do reports help? Well, it depends on their type.
Popular types of inventory reports
Some inventory reports are used by many shop owners constantly. These reports are beneficial to check at any time and are necessary for good inventory management. Let’s view them in detail and see how best to utilize them.
Average inventory and inventory on hand
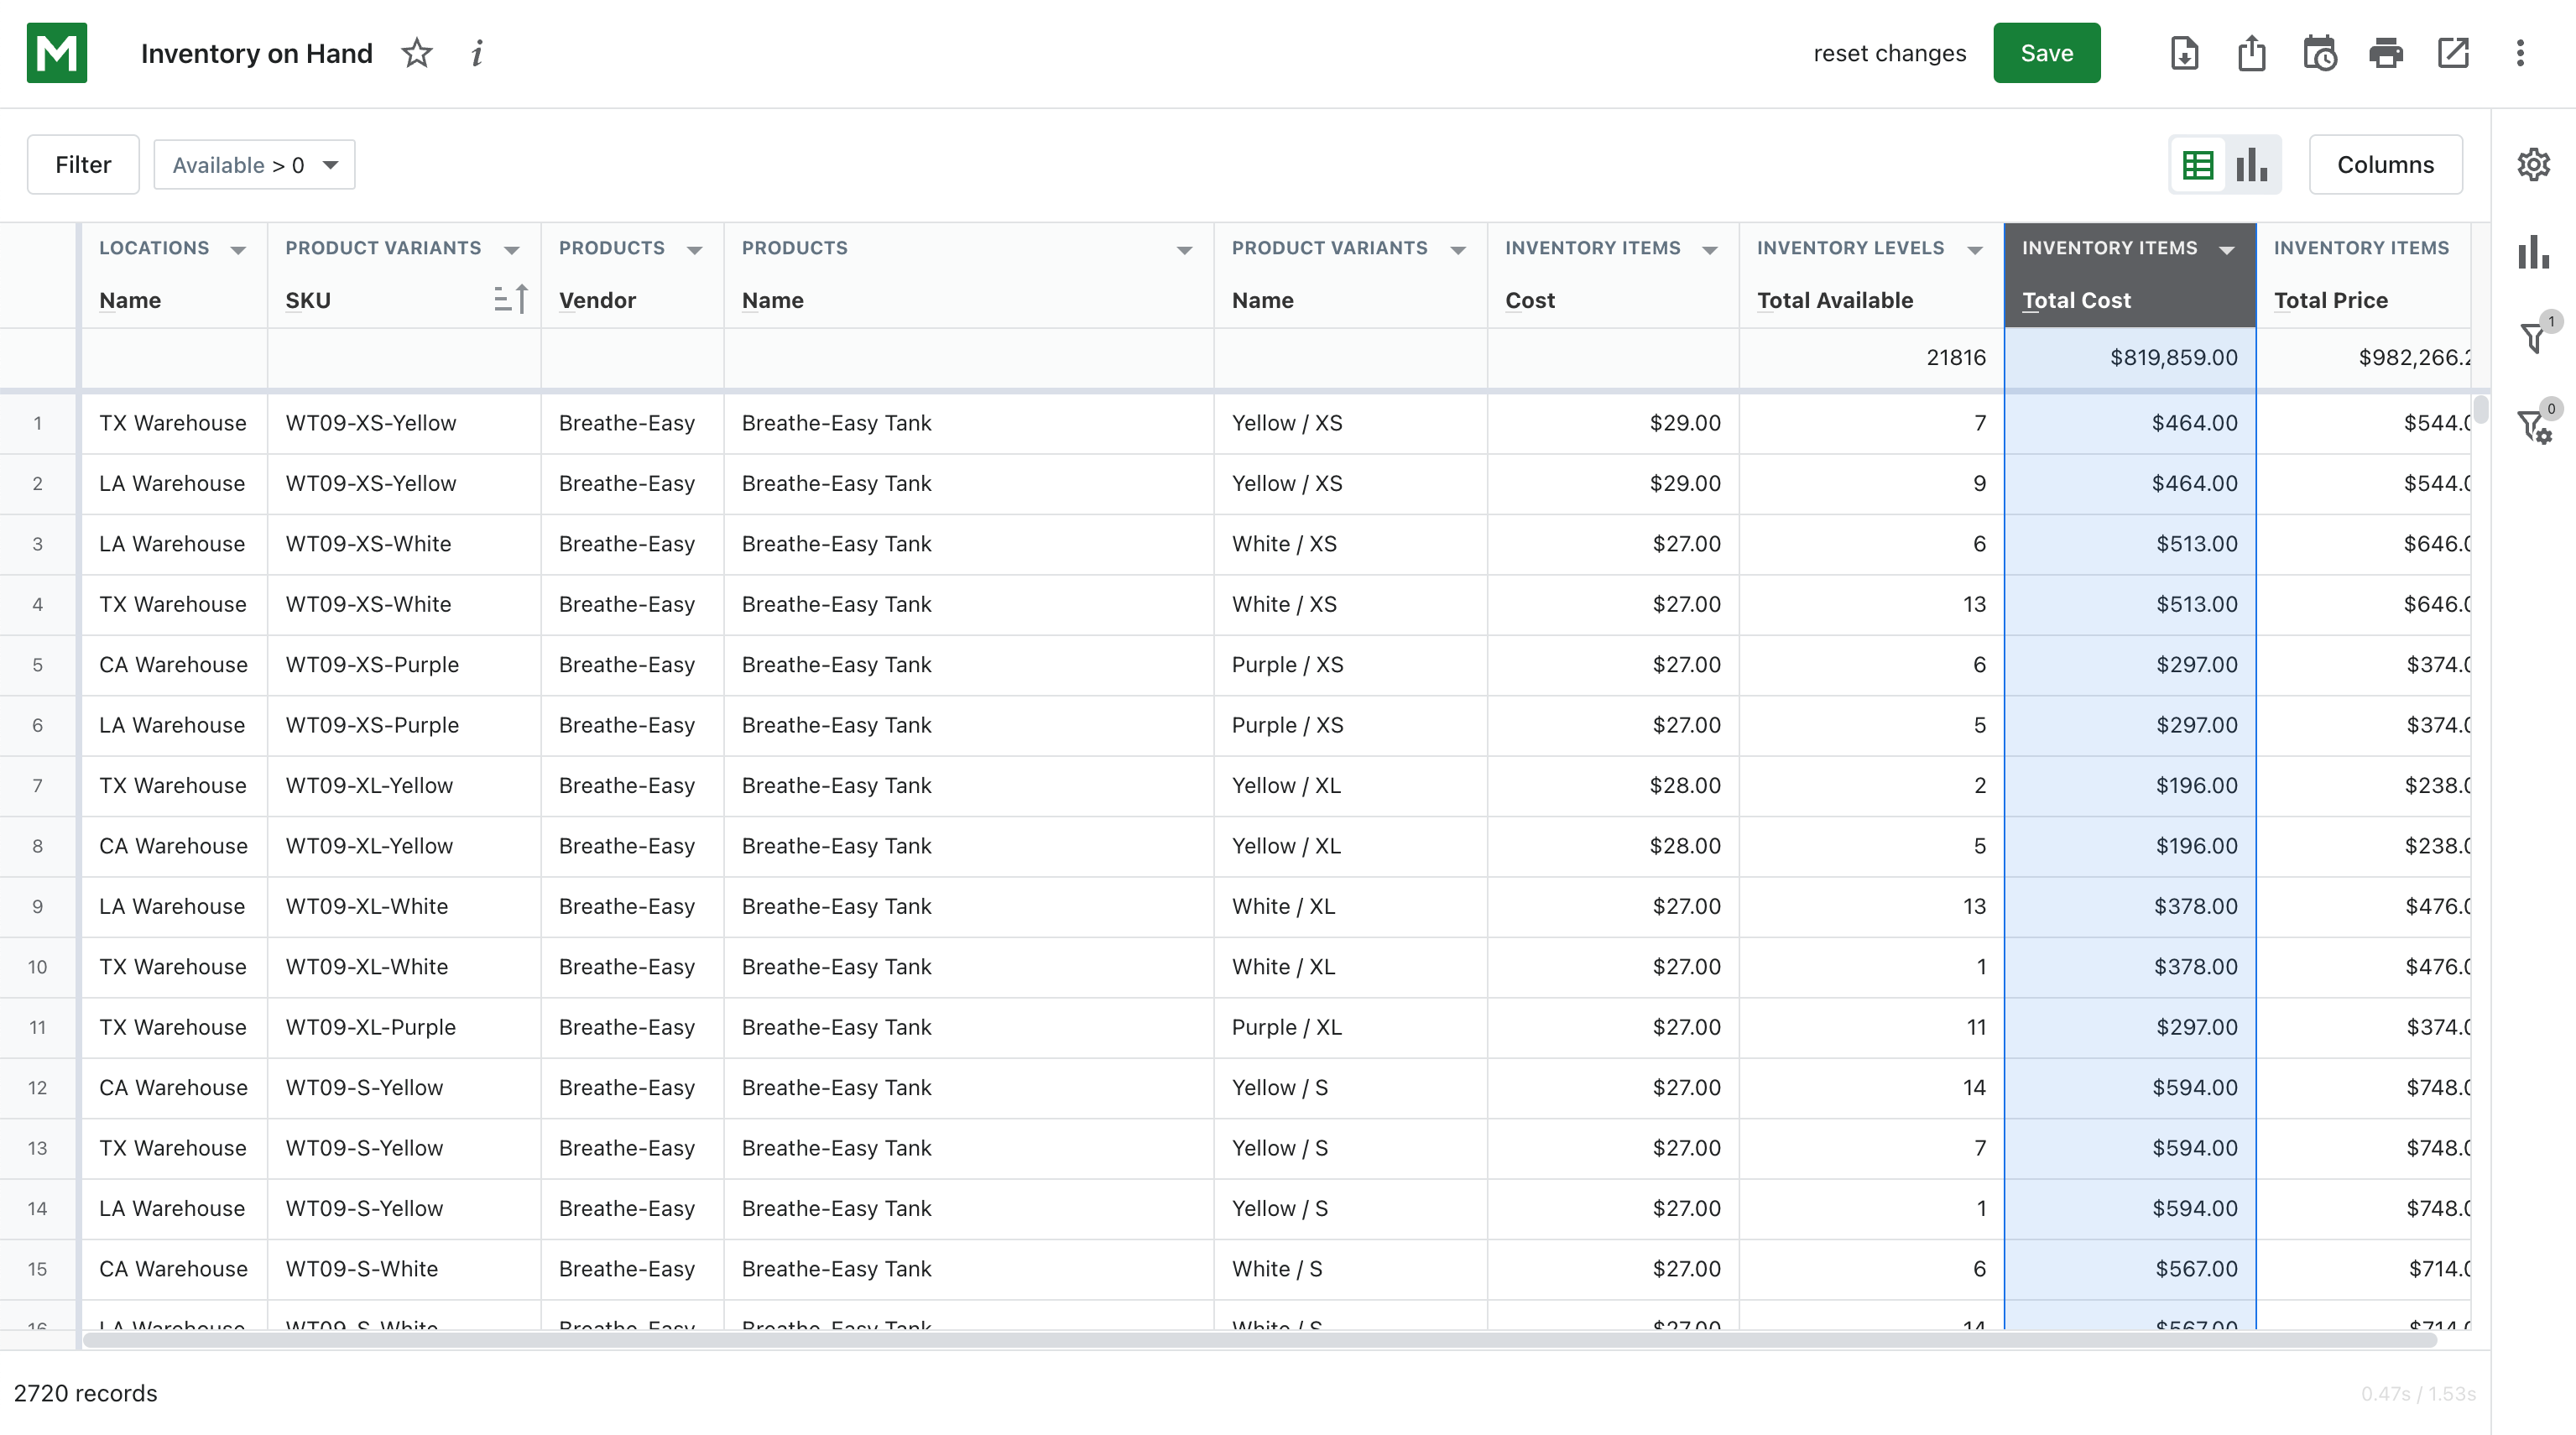
The “Inventory on hand” and “Average inventory” reports go hand-in-hand. They are both informing you about the contents of your stock. However, while the first generally shows the state of your current inventory, the second presents the average available stock.
Knowing your current stock is useful at all times. It helps to understand what your store is dealing with at the moment. Average inventory values may help you see stock changes in different periods and identify slow and fast points for sales.
Forecasting and planning reports
These reports have different names and some data variety but have the same purpose. Forecasting reports aim to predict when your stock will end and the best time to resupply. For example, the report can predict that you have goods for 10 days, and if restocking takes 7 days, it will suggest reordering in 3 days.
Different planning reports can use and provide other data, such as counting in safe stock. Most forecasting reports use average daily sales, sales velocity, lead time, and inventory turnover metrics to make predictions.
Planning reports are great for avoiding overstock and understock situations. Using them, you can determine the right time and resupply quantity so as not to run out and not leave spare remnants. Overstock can make you pay more for storage, and out-of-stock days can cause you to lose clients. Avoiding these situations increases your revenue.
Item performance
Item performance or item velocity report shows how well your products are selling. To calculate it, the report mostly uses sales numbers and time periods. Performance can be viewed for different time frames, like weekly or yearly. Some versions of it also use additional values to offset increased or decreased seasonal demand.
Determining item performance may help you find more profitable goods to focus on selling them. On the other hand, once you identify the slow-going stock, you can put out additional promotions to increase demand.
Inventory value
This report is similar to item performance. However, it works on a larger scale and helps to assess general potential profitability. It shows you how much your stock is worth, with additional costs like shipping, margin rates, etc. The report can be differentiated by timeframe, location, vendor, and item ranks (in the ABC method).
This report may be used to forecast profits and prepare financial statements for the end of the period. Knowing how much you can make from current stock also can help you plan inventory expansion.
Other inventory reports that will benefit you
Some inventory reports are useful but shine brighter when applied in certain conditions. For example, when you have a larger store or certain challenges in front of you. Here are these reports.
Inventory history and inventory snapshot
The inventory history and snapshot reports show you different data about your stock from a certain point in time. A history report usually tracks a certain period, and a snapshot shows the inventory state on a specific date or hour.
Cross-referencing certain periods or dates may help you find patterns in your commerce. For example, some periods might show higher or lower activity than others, demanding different planning. Or you can track the effectiveness of new promotional strategies over time.
Dead stock
This report analyses item demand based on average daily sales and last purchase date. As a result, it shows you products that haven’t sold for a long time and have overall low demand, effectively making them dead stock.
Checking for dead stock once a year or quarter can help you reduce storing costs. Items that don’t really sell anymore just take up valuable warehouse place and heighten storage fees. Not to mention wasted funds on the promotion of dead-weight items.
ABC analysis
ABC analysis report divides your stock into ranks depending on the item’s performance. For instance, products that make the most revenue will be A-ranked, and the least significant will be C-ranked. The main metrics for this report are sales velocity, demand, and earned profits.
If you have a large variety of items in your inventory, knowing which ones make you the most profit is useful. Knowing this, you can divide your resources to give A- and B-ranks more attention. C-rank can be maintained by junior staff or just overseen less frequently. Dividing resources according to ranks can free some time and lift the workload from you or your colleagues.
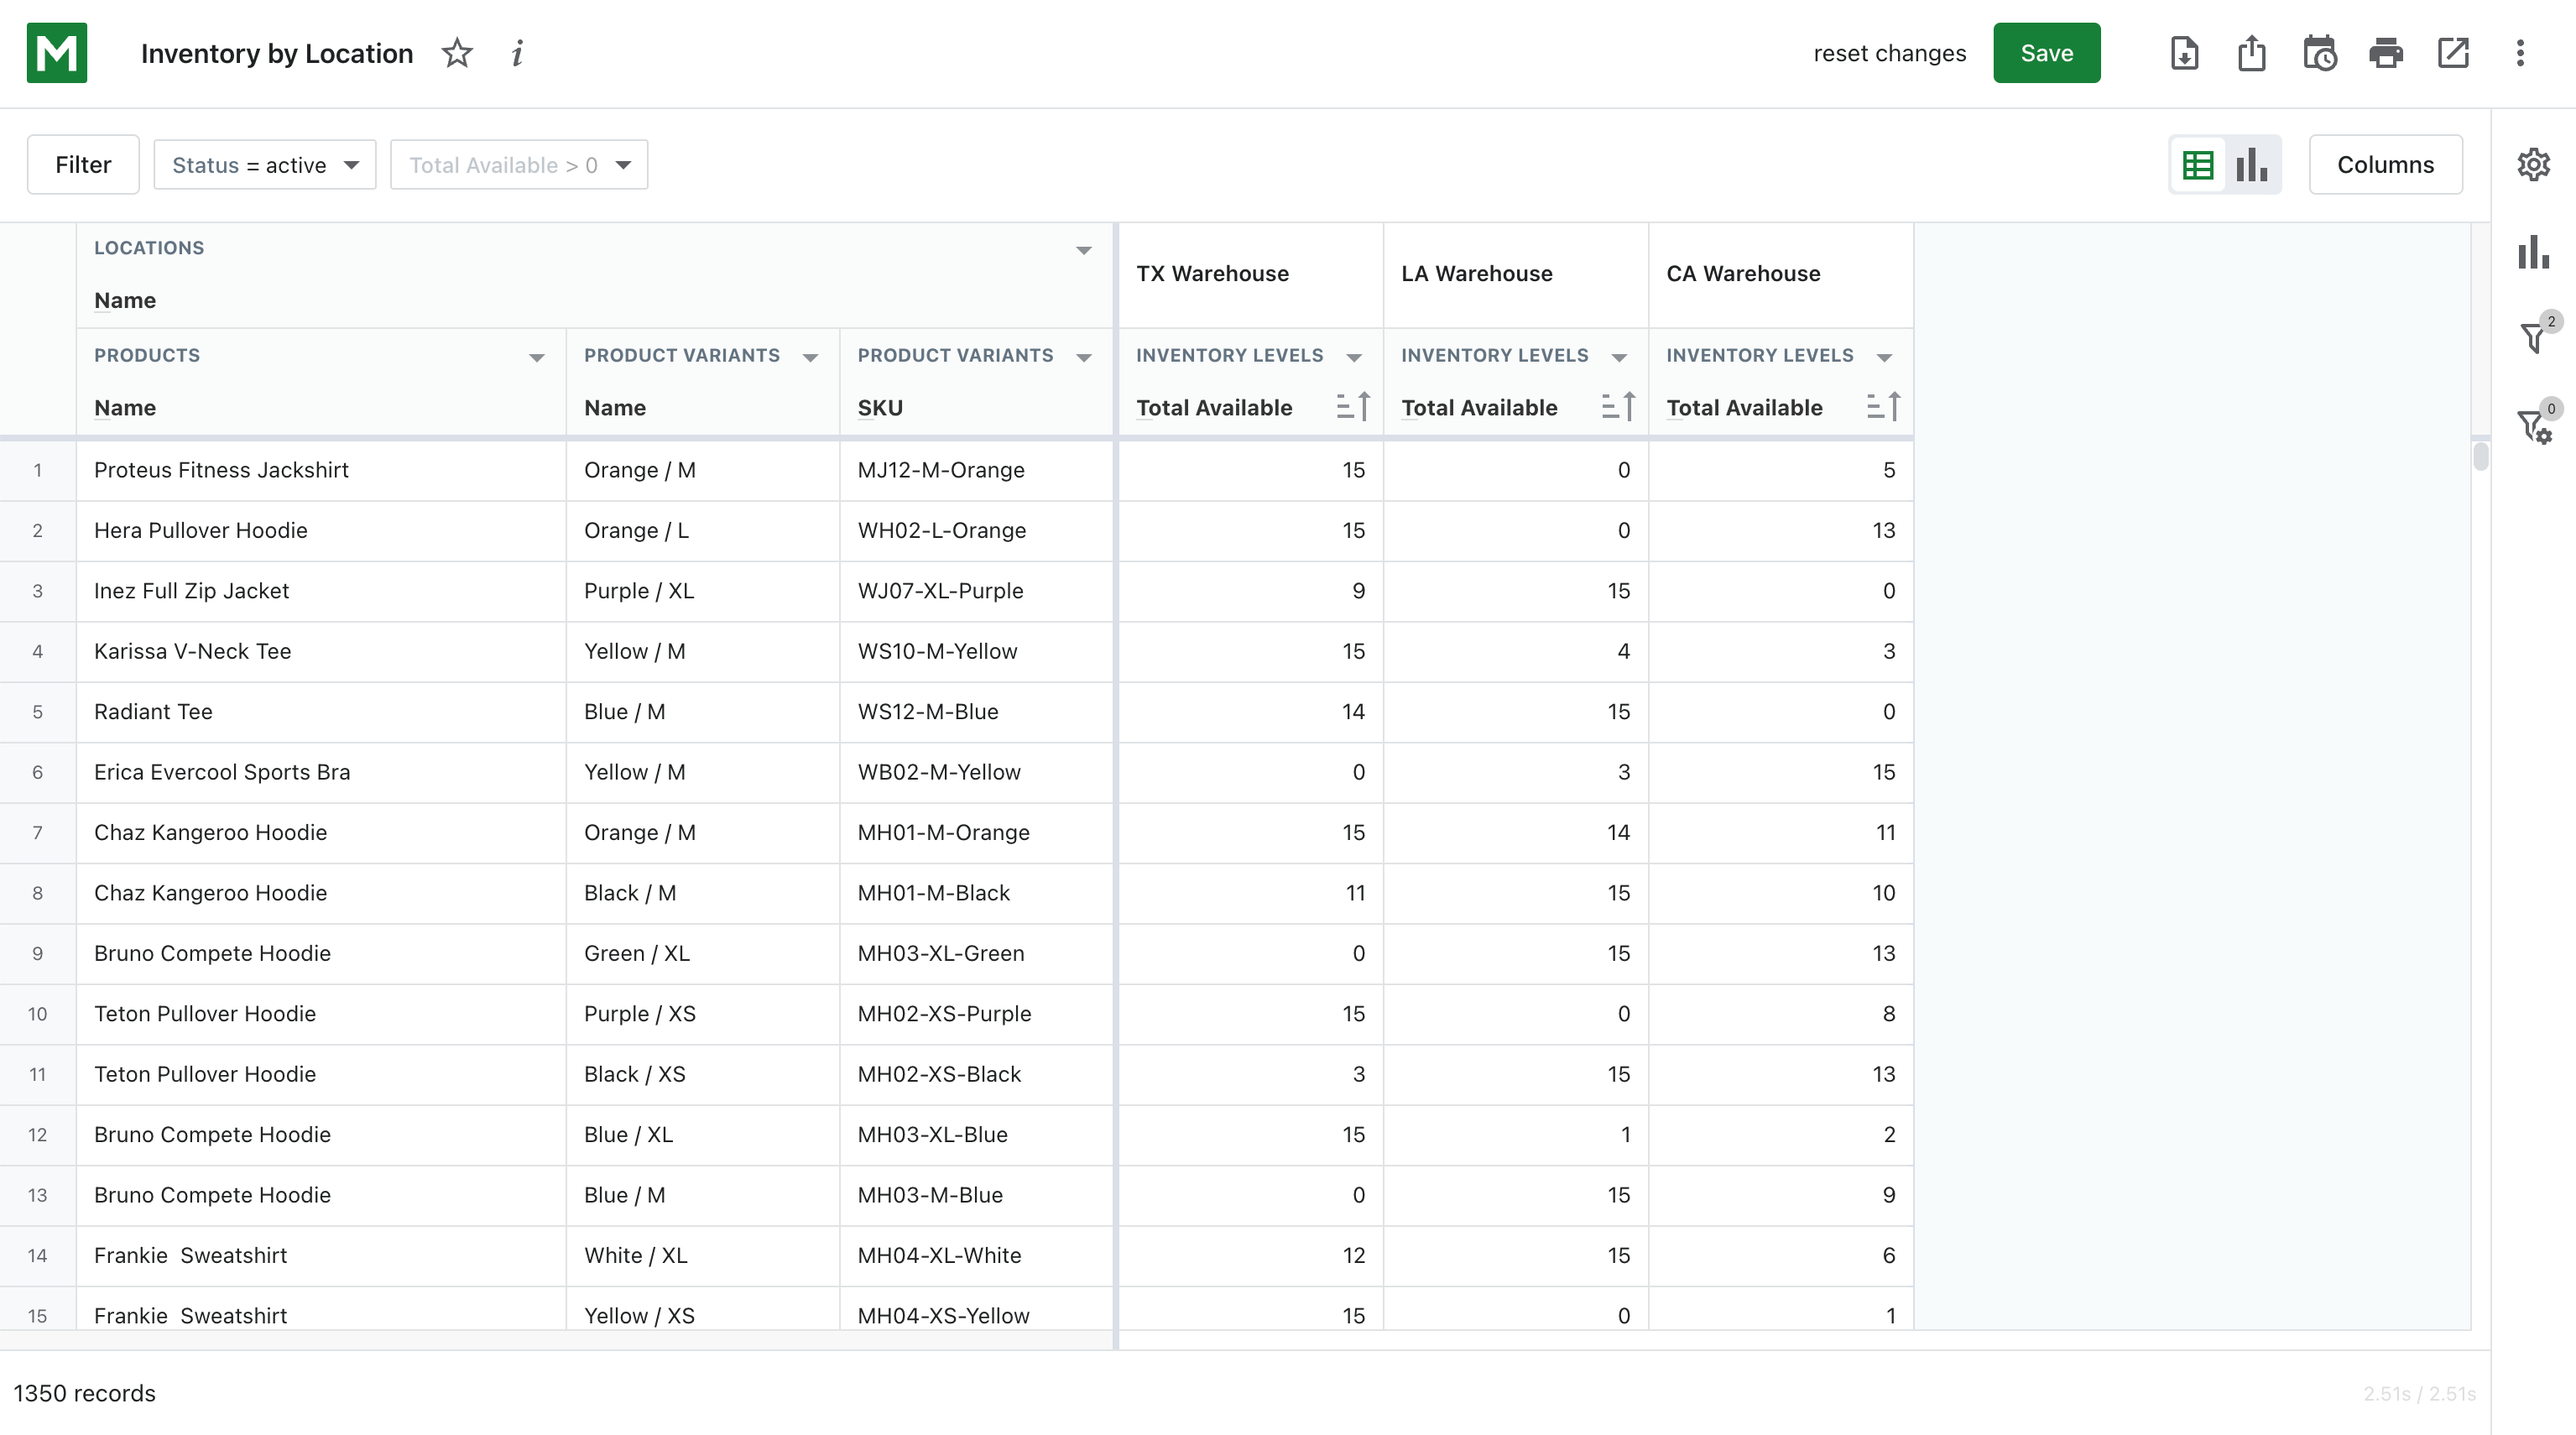
Stock by location
This simple report tracks the amount of stock between different warehouses or retail spots. It calculates stock based on an initial number of ordered items and following sales, fulfilled by different storing locations.
This report will work best if you have a few locations where you store your inventory. Seeing precise amounts of stock in different places may help you plan resupply based on the logistics of each location. Combined with product sales by region report, you can also move your stock for the best shipping efficiency.